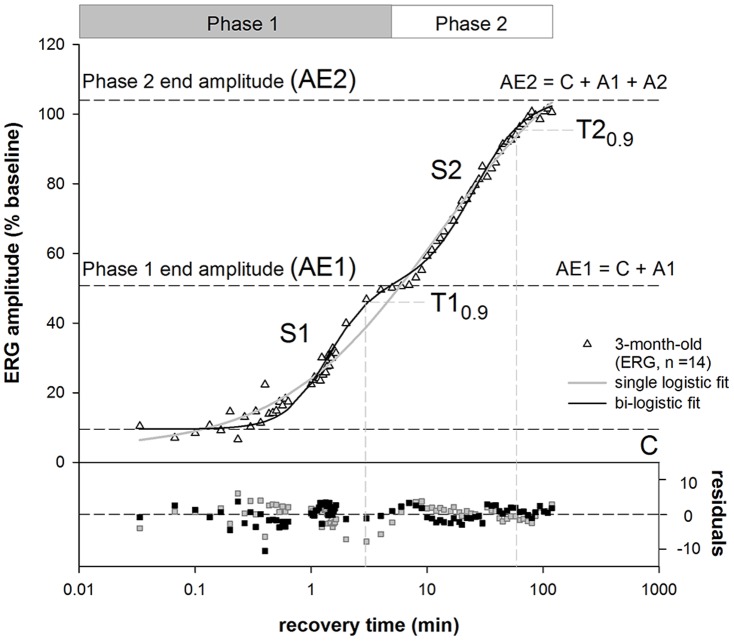
Figure 1. Single and bi-logistic models for recovery of ERG from IOP elevation.
Group averaged (n = 14, 3-month-old rats) ERG b-wave amplitudes were plotted against recovery time after IOP was restored to baseline. The bi-logistic function (Equation 2) provides a significantly better fit (black line, F-test, P<0.001, F = 15.80) compared with single logistic function (solid grey line, Equation 1). A is the amplitude of recovery, S is slope of the curve and C is the y-intercept. The suffixes 1 and 2 for each parameter represent the corresponding recovery phases. The time to 90% (T0.9, vertical dashed lines) was generated by the model and represents the speed of the recovery at each phase. The end of each phase was returned as the time when the data passed through AE1 or AE2; here this is 6 and 120 minutes. Additional parameters derived from the model include AE1 (A1 + C) which represent the amplitude of phase 1 (black dashed line). AE2 represents the final amplitude (black dashed line, AE2 = A1+A2+C).

