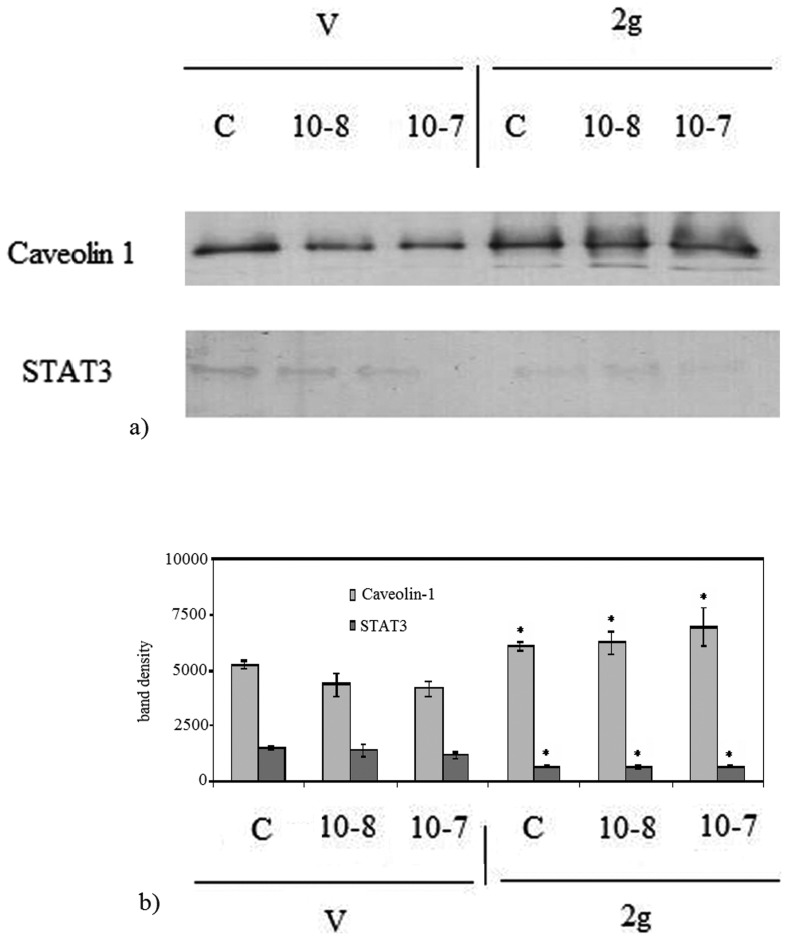
Figure 5. Effect of hypergravity on Caveolin 1 and STAT3 proteins.
Caveolin 1 and STAT3 in the thyroid tissue of vivarium (V) and 2 gravity (2 g) mice treated or not with 10−7 or 10−8 thyrotropin (TSH). a) bands of 22 kDa apparent molecular weight for Caveolin 1 and 90 kDa for STAT3 was indicated in relation to the position of molecular size standard; b) The area density was evaluated by densitometry scanning and analysed with Scion Image programme. The experiment was performed in right lobes of thyroid gland Data represent the mean ± S.D. of 7 2 g mice and 6 V mice. Significance, *P<0.001 2 g versus V.

