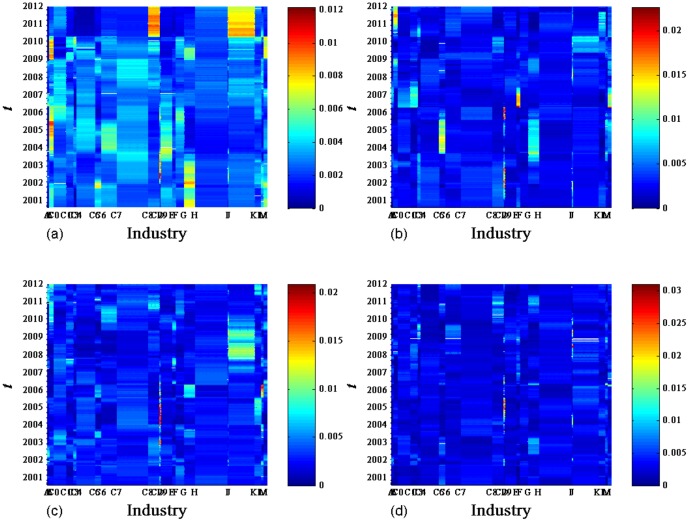
Figure 9.
(a). Contribution  of conventional industries.
  for
for  obtained from the correlation matrix of the return series of 367 A-Share stocks evolved with time
  . (b). Contribution
  of conventional industries.
  for
for  obtained from the correlation matrix of the return series of 367 A-Share stocks evolved with time
  . (c). Contribution
  of conventional industries.
  for
for  obtained from the correlation matrix of the return series of 367 A-Share stocks evolved with time
  . (d). Contribution
  of conventional industries.
  for
for  obtained from the correlation matrix of the return series of 367 A-Share stocks evolved with time
  .
.

