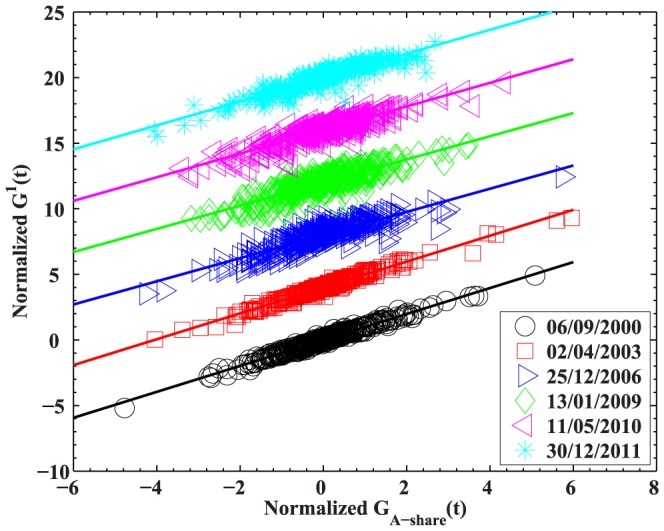
Figure 10. Projection  of the 367 stock returns on the largest eigenvector
  .
.

 obtained from the correlation matrices of the return series in the moving windows ended on 06/09/2000, 02/04/2003, 25/12/2006, 13/01/2009, 11/05/2010, and 30/12/2011, as a function of the return of the A-share Index of Shanghai Stock Exchange. The A-share Index is composed of all the A-share stocks listed on the Shanghai Stock Exchange. Curves are removed for clarity. A linear regression between the two normalized axes for different moving windows yields slopes: 0.99, 0.99, 0.88, 0.88, 0.90, and 0.91.
