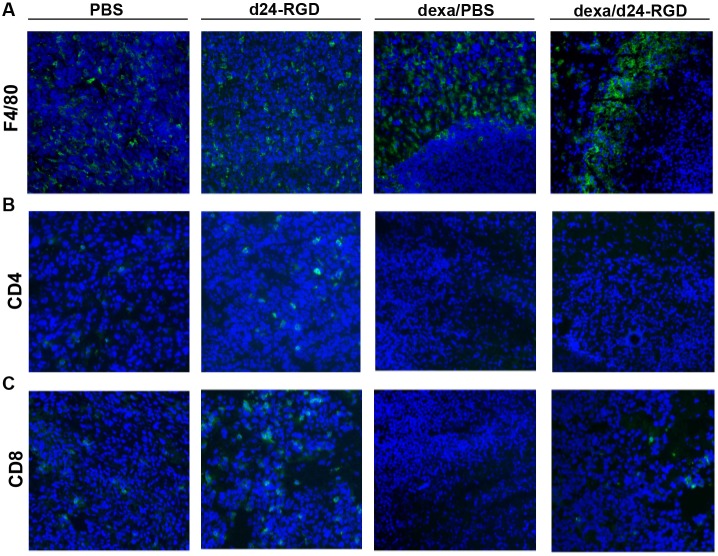
Figure 5. Influx and spatial distribution of F4/80+ macrophages, CD4+ and CD8+ cells.
Immunohistochemical analysis of F4/80+ macrophages (A), CD4+ cells (B) and CD8+ cells (C) at 14 days post injection. Where indicated mice received 10 mg/kg/day dexamethasone (the 2 right columns). Representative images of two mice per time-point are shown (magnification 20x).

