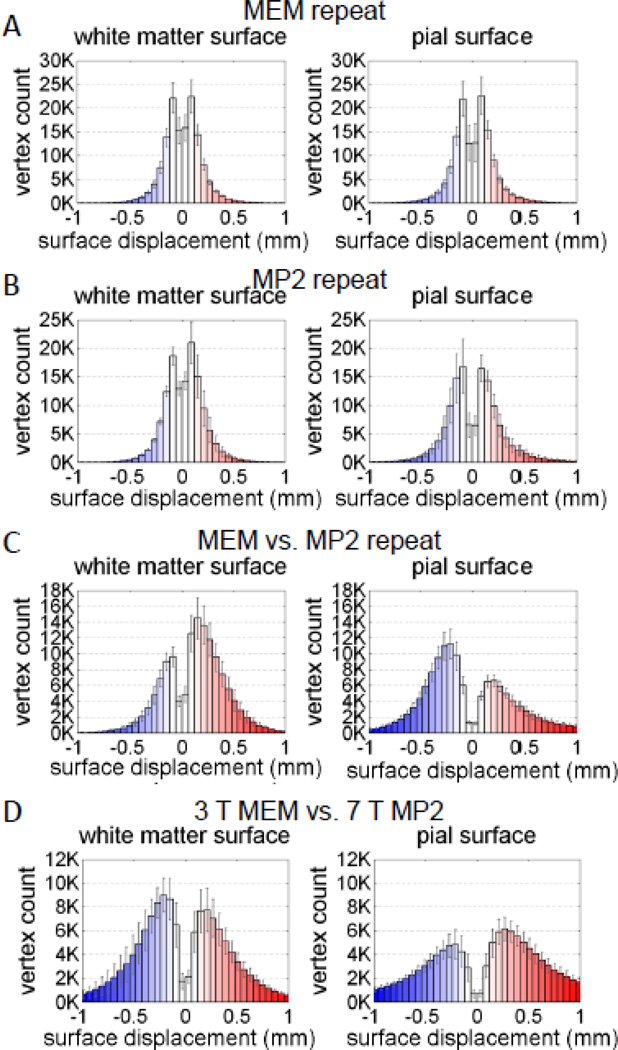
Fig. 9.
Histograms of signed distance across four subjects (eight hemispheres) for test-retest pairs and 3 T MEMPRAGE vs. 7 T MP2RAGE. Both (A) MEMPRAGE repeat and (B) MP2RAGE repeat have symmetric histograms whereas the (C) MEMPRAGE– MP2RAGE repeat comparison shows that the MP2RAGE white matter surfaces are positioned outward (i.e., the signed distance is more often positive valued, with a positive-valued distance indicating a displacement in the direction of the outwardpointing surface normal of the MEMPRAGE white surface) and the MP2RAGE pial surfaces are positioned inward relative to the MEMPRAGE surfaces. (D) The 3 T MEMPRAGE vs. 7 T MP2RAGE rescan comparison is also symmetric, although a larger discrepancy between the 3 T and 7 T surfaces relative to the other comparisons is apparent from the heavy histogram tails. The number of surface vertices across the population was 145249 ± 15762; the number of vertices in the FreeSurfer white and pial surface meshes are identical by design. (Histograms have been restricted to ± 1 mm to aid visualization.)

