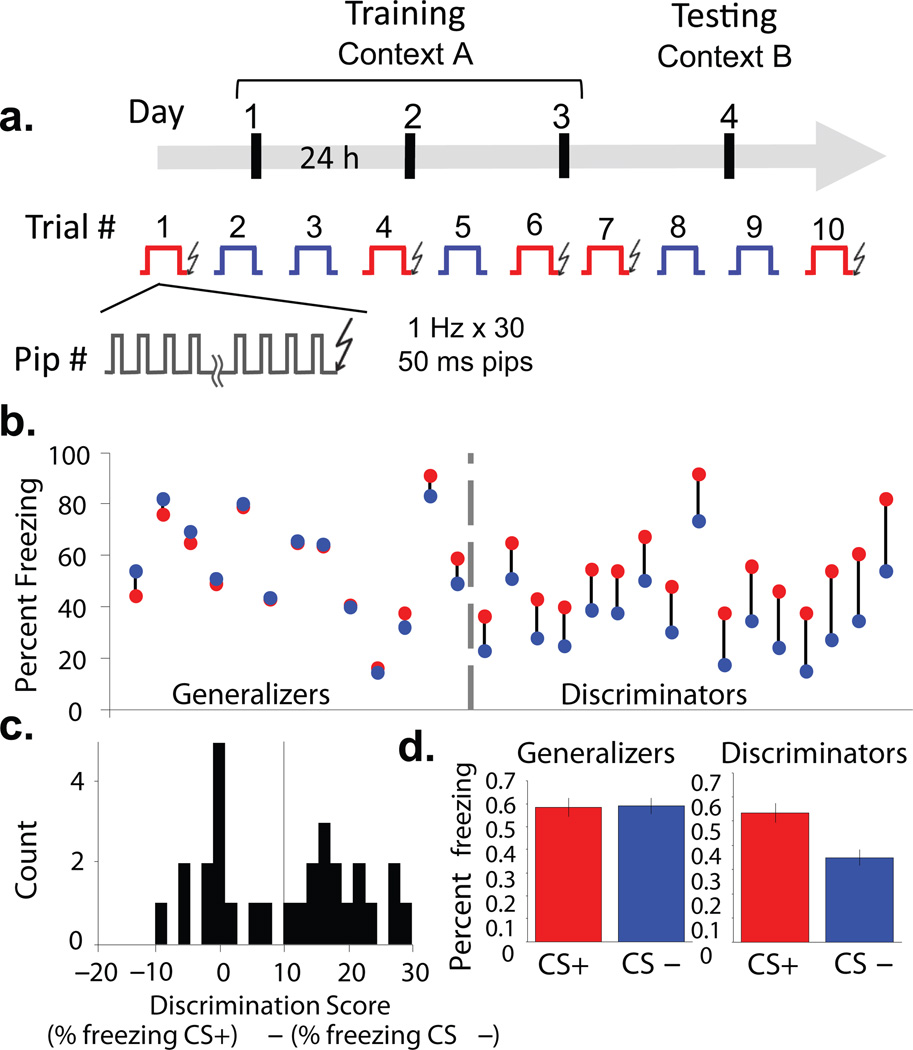
Figure 1. Individual variation in discrimination after differential fear conditioning.
(a) Experimental protocol. Over three successive days, mice were exposed to five presentations each of a CS+ (red) or CS− (blue). Each stimulus consisted of 30 pips, 50 ms in duration, presented at 1 Hz. Each presentation of the CS+ was paired with a 1 s shock. On the fourth day, freezing responses to five additional presentations each of the CS− and CS+ were assessed in the absence of shock. (b) Individual animals’ freezing to CS+ (red circles) and CS− (blue circles). (c) Histogram of discrimination scores in the sample; vertical line, cutoff for discrimination (d) Freezing to CS+ and CS− for Generalizers (left) and Discriminators (right), (mean +/− s.e.m.).

