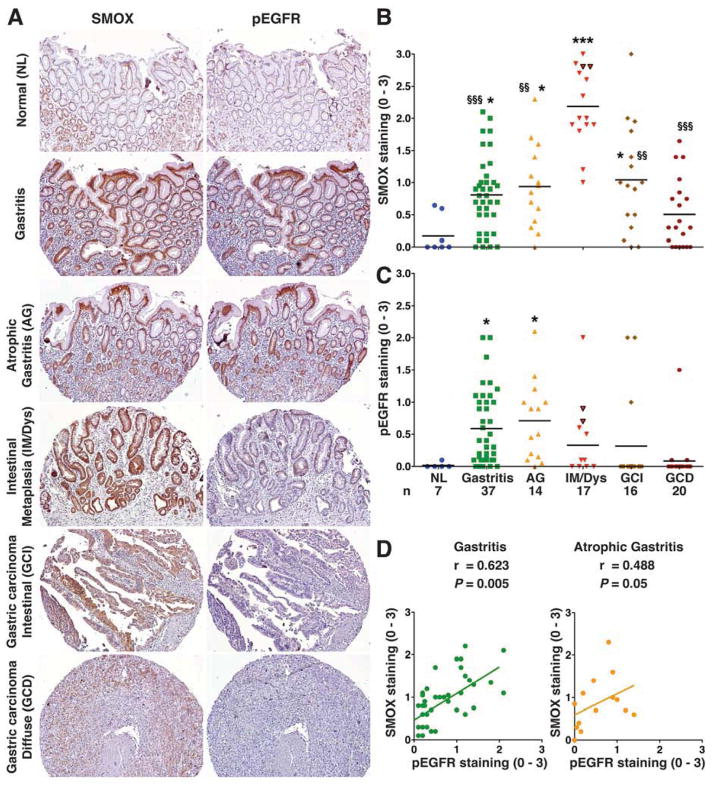
Figure 2.
Levels of SMOX and pEGFR in human TMA. (A) Immunohistochemistry for SMOX and pEGFR at 100X magnification. (B, and C) Scoring of SMOX and pEGFR staining intensity in epithelial cells from immunohistochemistry analysis. (D) Correlation (Pearson coefficient) between SMOX and pEGFR levels. In B and C, each circle represents a different TMA core; *P < .05, ***P < .001 vs normal tissue; §§P < .01, §§§P < 0.001 vs IM/Dys tissues. Triangles with black borders represent cores with dysplasia. For B and C, the number of patient cores for each diagnosis is indicated. NL, normal; Gastritis, non-atrophic gastritis; AG, atrophic gastritis; IM/Dys, intestinal metaplasia/dysplasia; GCI, gastric carcinoma intestinal type; GCD, gastric carcinoma diffuse type.

