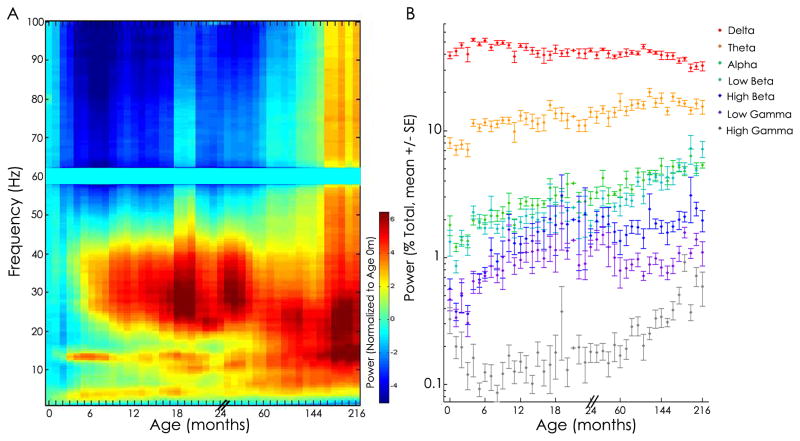
Figure 2. Cortical power spectra across development.
A. Visualization of power spectra. Relative power in decibels (averaged across all electrodes) is plotted as a function of age and frequency, averaged across adjacent age bins, and normalized to age 0 months. In general, lower frequencies (<5 Hz) dominate over early infancy and higher frequencies increase in power over childhood. Additional structure is also present. For example, a prominent increase in power is present in the low beta band during infancy and in the high beta and low gamma bands during the second year of life. B. Average relative power in five frequency bands. The percent total power (+/− SEM) across seven classical frequency bands is plotted for each age group (note, the x-axis is not continuous; please see Methods for age bins). Complex dynamics are observed, but in general, delta power is highest in infancy and power in the higher frequency bands (>4 Hz) significantly increases with age (ANOVA, p<0.0001 for each frequency band). Note: Separate color schemes reflect power in 1A and frequency band in 1B.

