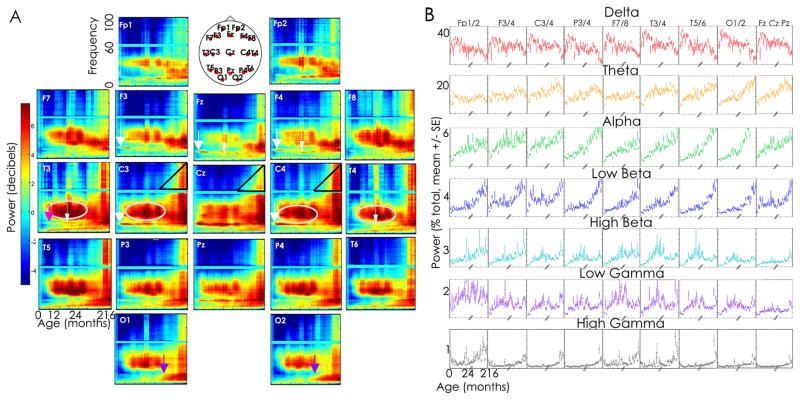
Figure 3. A. Regional power spectra.
Average relative power in decibels is plotted as a function of age and frequency for each voltage tracing, averaged across adjacent age bins and normalized to age 0 months. We plot the average electrode location on the head schematic for representative location of the electrode sensors. Several regionally specific frequency dynamics are observed. For example, prominent beta and gamma activity is present in central and temporal regions from 6m to 5y (silver circles), while prominent alpha and theta activity appears at 5y in the posterior regions (purple arrows). Two distinct bands of activity are present in the midline and frontocentral region at age 2 months (14 Hz, broad white arrows) and 12–18 months (11 Hz, narrow white arrows) while 3 distinct bands (centered at 5 Hz, 11 Hz, and 14 Hz) are present in the left temporal region at age 18 months (pink arrow). High frequency power (>60 Hz) increases steadily after age 5 years, most prominently in the central regions (black triangles). B. Regional power spectra in classical frequency bands. Average power is plotted for each age in each frequency band for each electrode derivation. Results of homologous electrodes are averaged for ease of visualization. Marked spatial structure is present in the relative power in each frequency over development. In the delta band, the dramatic rise and fall in power in the first 15 months followed by a second fall in adolescents is evident in all electrode locations, though most prominent in the temporal and occipital electrodes. In the theta band, prominent increases in theta activity are observed through childhood in the central and parietal regions, which persist through adolescence in the occipital regions. In the alpha band, early increases in relative power are present in infancy, and most prominent in the frontocentral regions, followed by a dramatic increase in power in the parietal, temporal and occipital regions over childhood and adolescence. In higher frequencies, a peak in low beta activity is present in the frontocentral regions during infancy, a prominent peak in high beta activity is present in the temporal regions during the second year of life, and a rise in low gamma activity is present in the frontal region through 2 years before a subsequent relative decline.

