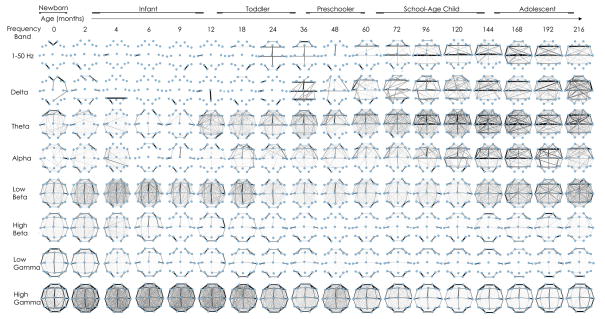
Figure 4. Functional network topology across development during sleep.
The average networks are plotted for age groups ranging from 0 months through 18 years (averaged across adjacent age bins) using cross correlation (broadband, 1–50 Hz) and coherence measures for narrowband frequencies (delta, theta, alpha, beta, high beta, low gamma, high gamma) frequencies. Nodes represent average location of voltage recordings used in the nearest neighbor Laplacian reference. Edges represent presence of significant coupling between cortical voltage recordings. The width of the edge is drawn proportional to its weight, such that the most persistent edges present over the recording epoch are dark and thick. Striking topological organization is present across development in each frequency band (please see text).

