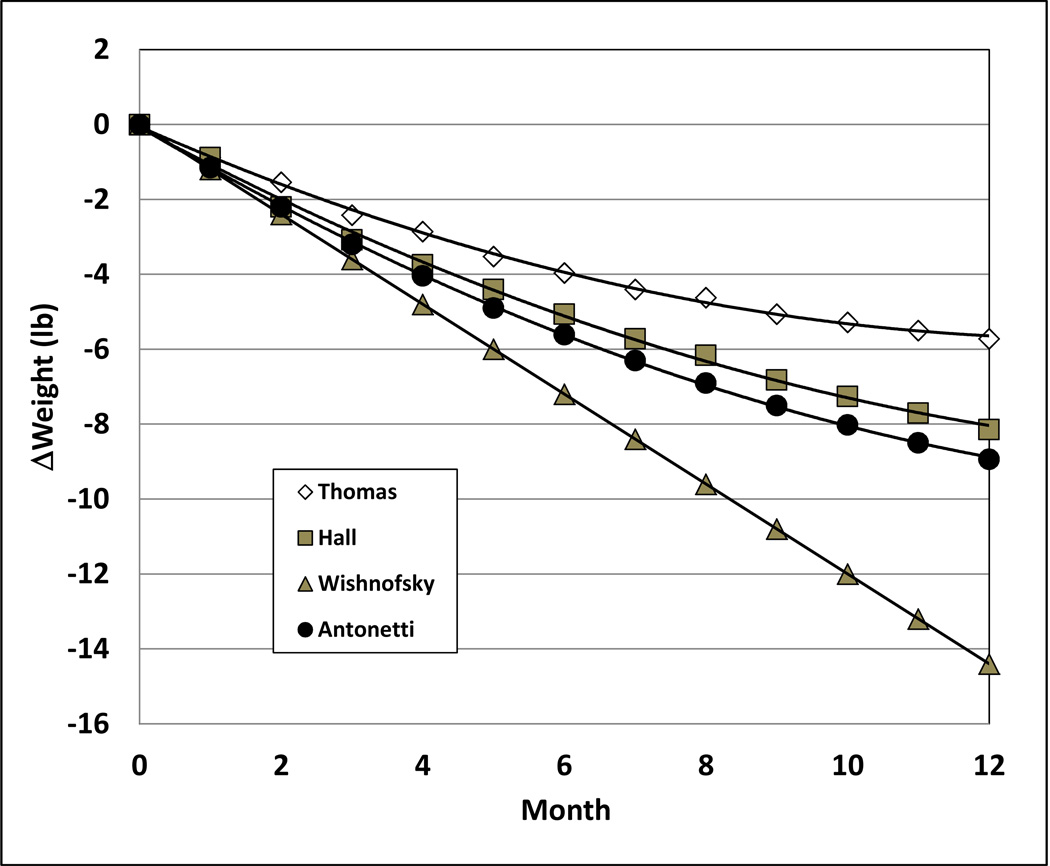
Figure 3.
Change in body weight (expressed in lbs) predicted by Thomas10, Hall19,20, Antonetti16, and Wishnofsky1 models when an overweight woman (age 30 yrs, height 168 cm, weight 76 kg, BMI 27 kg/m2) reduces her intake by one-soda (140 kcal) per day. Variance during intake reduction for the Thomas model is expressed by the Bland Altman confidence intervals calculated for the CALERIE study as presented in Figures 1 and 29,24.

