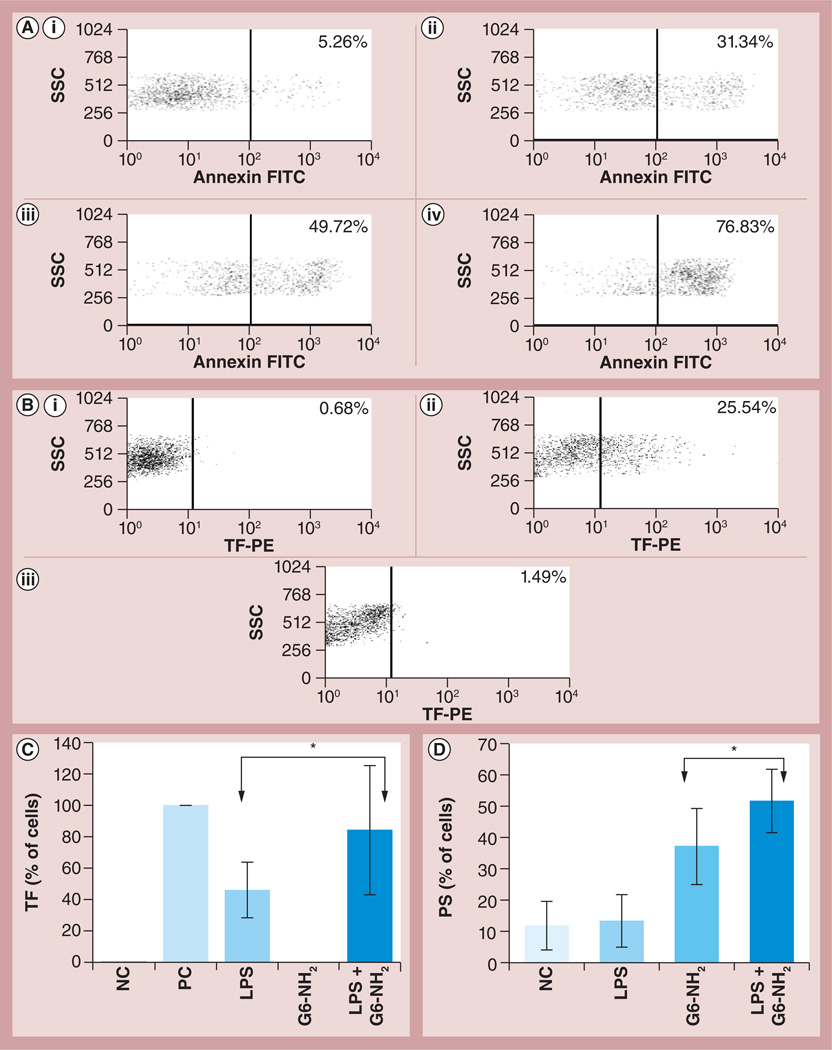
Figure 1. Flow cytometry analysis of tissue factor expression and phosphatidyl serine presentation on the leukocyte surface in response to endotoxin, dendrimers and the combination thereof.
Peripheral blood mononuclear cells from healthy donor volunteers were treated with LPS and G6-NH2 alone or in combination for 24 h. (A) PS presentation on the surface of cells incubated with increasing concentrations of G6-NH2 dendrimers; (i) 4, (ii) 8, (iii) 10 and (iv) 25 µg/ml. (B) TF expression on the surface of cells (i) untreated or incubated with (ii) 1 ng/ml LPS or (iii) 4 µg/ml of G6-NH2 dendrimers. (C) TF expression on the surface of cells treated with 1 ng/ml LPS or 4 µg/ml G6-NH2 dendrimers alone or in combination (LPS + G6-NH2). Shown is the mean value ± standard deviation of percentage-positive cells derived from analysis of ten donor specimens. PC was assigned a 100% value. (D) PS presentation on the surface of cells treated with 1 ng/ml LPS or 10 µg/ml G6-NH2 dendrimers alone or in combination (LPS + G6-NH2). Shown is the mean value ± standard deviation of percentage-positive cells derived from analysis of six donor specimens. *p < 0.05.
FITC: Fluorescein isothiocyanate; G6-NH2: Generation 6 amine-terminated polyamidoamine dendrimer; LPS: Lipopolysaccharide; NC: Negative control (cell culture media); PC: Positive control (10 µg/ml LPS); PE: Phycoerythrin; PS: Phosphatidyl serine; SSC: Side scatter; TF: Tissue factor.

