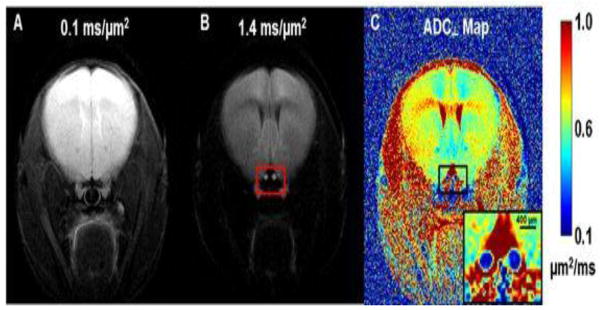
Figure 1.

Two diffusion-weighted images (DWI), which were zero-filled to 512 × 512, with diffusion-sensitizing gradients applied in the phase-encoding direction (left-to-right) with b values of 0.1 ms/μm2 (or 100 s/mm2) (A) and 1.4 (B) ms/μm2 (or 1400 s/mm2) were used to generate the resulting ADC⊥ map (C). The red box in panel B highlights the location of optic nerves (bright) and surrounding cerebrospinal fluid, which is highly suppressed. ADC⊥ values in the optic nerves are considerably lower than in other brain tissues. The regular (nearly circular) shape of the optic nerves suggests good orthogonality between the nerve axes and the slice plane, which minimizes partial volume effects.
