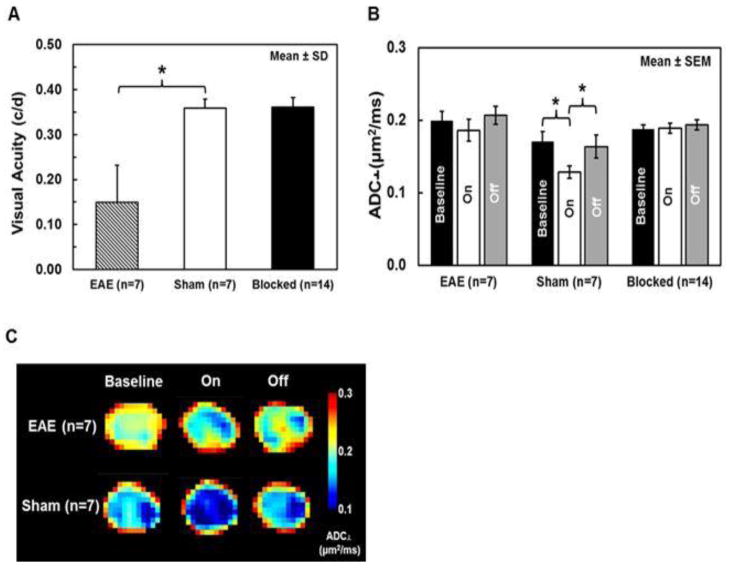
Figure 2.
Group-averaged visual acuity was significantly decreased by 58% (p < 0.005, vs. sham) in affected EAE eyes (n=7) compared with the normal vision of sham eyes (n=7); the visual acuity of contralateral blocked (n=14) eyes was in the normal range (A). In this mouse model of EAE optic neuritis, visual deficits typically develop asymmetrically, beginning in only one eye. An activation-associated ADC⊥ decrease was observed in both EAE and sham eyes but not in blocked eyes (B, C, and Table 1), suggesting that the decreased ADC⊥ in stimulated EAE and sham optic nerves was caused by axonal activity. When compared to its own baseline and stimulus-off, ADC⊥ significantly decreased in sham optic nerves by 25 and 22%, respectively (both p < 0.005, B, C, and Table 1), with visual stimulation. In contrast, only a slight and non-significant ADC⊥ decrease (7%, p = 0.45, vs. baseline and 10 %, p = 0.13, vs. stimulus-off) was observed in EAE optic nerves (B, C and, Table 1). Group ADC⊥ maps of EAE (n=7) and sham (n=7) optic nerves were generated by averaging stacked ADC⊥ maps, which were interpolated to 1024 × 1024 (C).
* indicates p < 0.005

