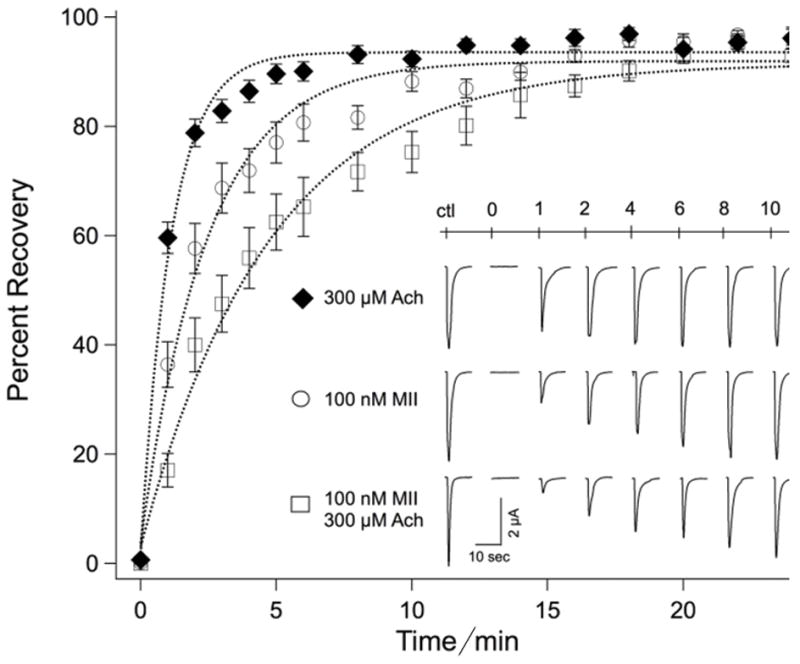
Figure 7.

Kinetics of recovery from ACh receptor desensitization (black diamond), α-CTxMII (open circles) or both ACh + α-CTxMII (open squares). Responses to local application of ACh are shown in the inset for each treatment for times indicated, and are plotted as percent recovery. Values represent the mean ± standard error of the mean for 15 to 25 experiments.
