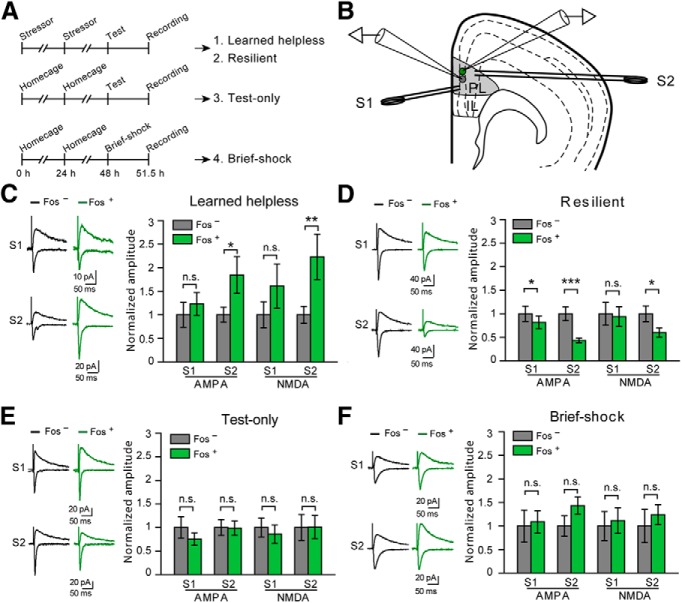
Figure 2.
Synaptic modifications in the mPFC associated with susceptibility and resilience to learned helplessness. A, A schematic of the experimental procedure. Top, Mice were subjected to the learned helplessness procedure and were separated into “learned helpless” (1) and “resilient” (2) groups (see Materials and Methods). Middle, Mice were exposed only to the learned helplessness testing session (“test-only”) (3). Bottom, Mice were exposed to 10 brief foot shocks (“brief-shock”) (4). B, Schematic of the recording configuration. Synaptic responses onto a Fos+ (green) cell and that onto a Fos− (gray) cell in the PL are simultaneously recorded. Synaptic transmission is evoked by two stimulating electrodes: one (S1) placed in layer 2/3 and the other (S2) in layer 5/6. C, Data from the “learned helpless” group. Left, Representative traces of EPSCs, which were recorded from a Fos+ neuron (green) and an adjacent Fos− neuron (black), and which were evoked by S1 (top) and S2 (bottom). Right, Quantification of AMPAR- and NMDAR-mediated EPSC amplitude, which is normalized to the mean EPSC amplitude of Fos− neurons. EPSCs are larger in Fos+ cells in response to S2 stimulation. D, Data from the “resilient” group. Data presentation is the same as that in C. EPSCs onto Fos+ cells were smaller than those onto Fos− cells. E, Data from “test-only” group. Data presentation is the same as that in C. No significant difference was found. F, Data from “brief-shock” group. Data presentation is the same as that in C. No significant difference was found. *p < 0.05. **p < 0.01. ***p < 0.001. n.s., Nonsignificant.

