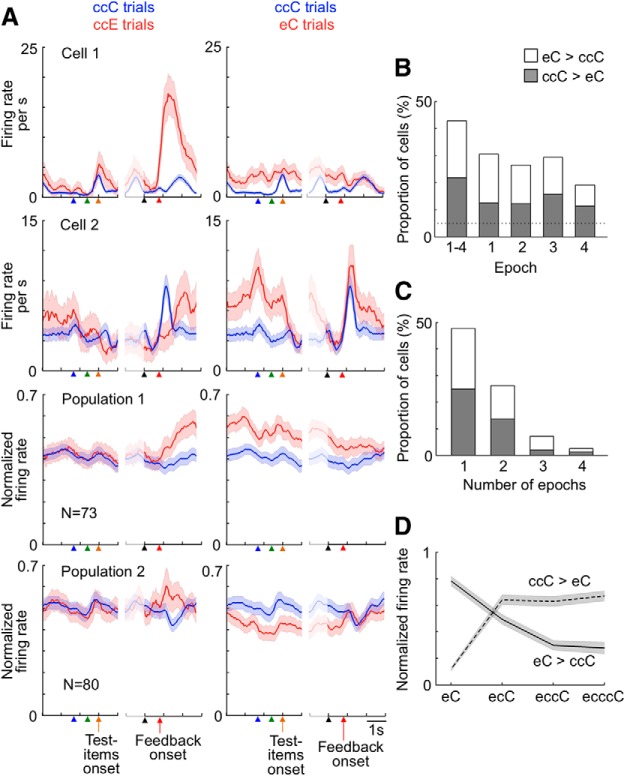
Figure 10.
Larger or smaller activities in trials following an error trial during the task performance. A, Top two rows, Activities of two example cells. Bottom two rows, Averaged activities of two cell populations. Graphs in each row represent activities of the same cell or cell group. Shadows represent SEM across trials for example cells and SEM across cells for populations. Cells in Populations 1 and 2 were selected by comparing activities in Epochs 1–4 between eC and ccC trials. Cells in Population 1 showed significantly larger activities in eC trials than their activities in ccC trials (p < 0.050), and their activities in ccE trials were not significantly larger than their activities in ccC trials (p > 0.10). Cells in Population 2 showed significantly smaller activities in eC trials than their activities in ccC trials (p < 0.050), and their activities in ccE trials were not significantly smaller than their activities in ccC trials (p > 0.10). B, The proportion, among all the recorded cells (343 cells), of the cells with significant differences between eC and ccC trials (p < 0.050), without significant differences between ccE and ccC trials (p > 0.10), at each epoch. Leftmost bar represents the proportion of cells in Populations 1 and 2 selected by applying a two-way ANOVA to activities in Epochs 1–4 together. C, The proportion, among the 153 cells in the Populations 1 and 2, of the cells that showed significant differences in one, two, three, or four of the epochs. B, C, Open parts of the bars represent the cells with larger activities in eC trials than in ccC trials; shaded parts represent the cells with smaller activities in eC trials than in ccC trials. D, Averaged activities of cells in Populations 1 and 2 (shown by solid and broken lines, respectively) in Epochs 2 and 3 of eC, ecC, eccC, and ecccC trials. The activities were normalized in each cell by setting its maximum and minimum activities to 1 and 0, respectively, and then averaged across cells in each cell population. Shadows represent SEM across cells.

