
Figure 3.
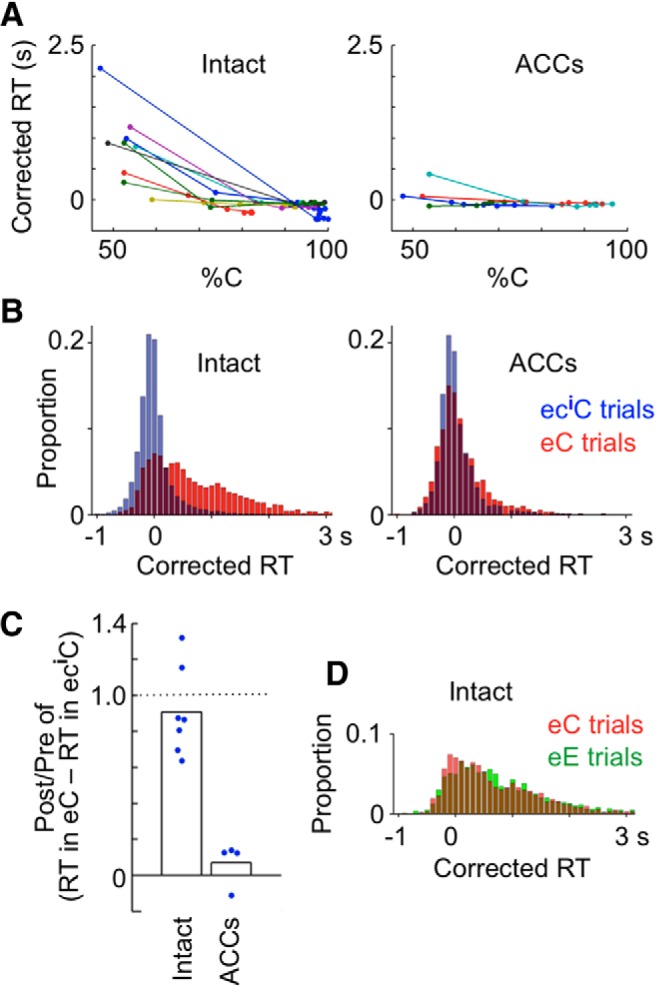
Dependence of RT on the error likelihood component determined by the response type (correct or error) history. A, RT in ecnC trials (correct trials following a sequence of an error trial and n consecutive correct trials) plotted against %C in after-ecn trials (n = 0–6) for nine intact monkeys (left) and for four ACCs-lesioned monkeys (right). The lines connect data points of each monkey in the order of n. Different colors indicate data in different monkeys. RT was corrected in that the mean RT averaged over all cC trials in each block was subtracted from RTs in individual trials. Mean RTs in cC trials were on average 1.01 ± 0.25 s in intact monkeys and 1.08 ± 0.21 s in ACCs-lesioned monkeys. B, RTs in eC trials compared with those in eciC trials. The number of trial sequences (eC or eciC) with RTs in the bin (100 ms) divided by the total number of the trial sequences is plotted against RT. Trials were pooled for nine intact monkeys (left) and for four ACCs-lesioned monkeys (right). The “i” was determined in each monkey so that the difference in %C between after-e and after-eci trials just exceeded 20%. C, Postlesion versus prelesion ratio of differences between median RTs in eC trials and median RTs in eciC trials in individual monkeys. The postlesion value was divided by the prelesion value in each monkey, and the ratio was averaged across monkeys in each group. Bars represent the averaged ratio, and dots indicate the ratios in individual monkeys. D, RTs in eE trials (error trials following an error trial), compared with those in eC trials, in the nine intact monkeys.