Figure 3.

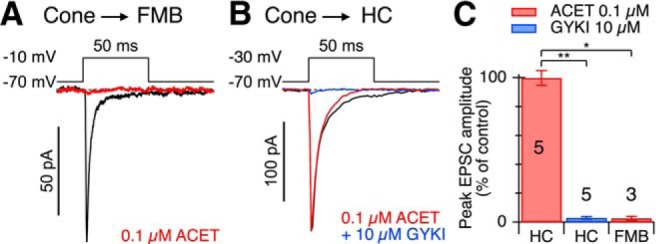
Cone to FMB EPSCs are mediated by KARs. A, Paired recording between a cone and an FMB cell. The cone voltage-step timing and magnitude are indicated above traces. The traces under each condition represent averages of 13 stimuli. Application of 0.1 μm ACET suppressed the peak amplitude of the evoked EPSC by ∼97%. B, Paired recording between a cone and a horizontal cell (HC) provides a positive control. The cone voltage-step timing and magnitude are indicated above the EPSCs. The traces for each condition represent averages of 8–10 stimuli. Application of 0.1 μm ACET had little effect on the peak amplitude of the HC EPSC, whereas subsequent addition of 10 μm GYKI 53655 suppressed the peak amplitude of the evoked EPSC by ∼98%. C, Bar graph showing the effects of ACET and GYKI on average peak EPSC amplitudes during paired recordings between cones and the cell type indicated. The numbers of cell pairs averaged for each condition are indicated on the bars. Error bars indicate ±1 SEM. *p < 0.05 (two-tailed Wilcoxon Rank Sum test). **p < 0.01 (two-tailed Wilcoxon Rank Sum test).
