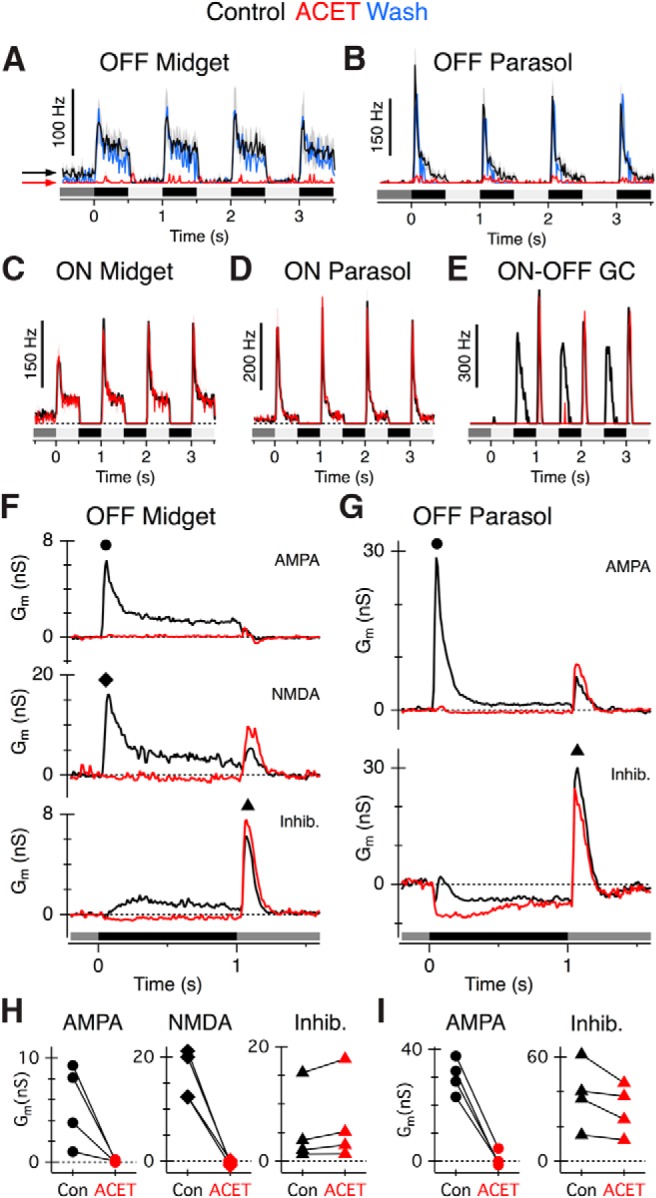
Figure 4.

ACET suppresses light-evoked excitatory input to OFF-midget and OFF-parasol ganglion cells. Light stimulus timing and contrast is shown below traces for A–G. A–D, Average peristimulus spike-time histograms in OFF midget (n = 5), OFF parasol (n = 5), ON midget (n = 3), and ON parasol (n = 5) ganglion cells in control conditions (black traces) and during application of 1 μm ACET (red traces). ACET suppressed spiking in OFF-type, but not ON-type, ganglion cells. Note that the background spiking in OFF midget cells was blocked by ACET (arrows), but not in ON midget cells. Washout responses (blue traces) are averages obtained from 4 OFF parasol and 2 OFF midget ganglion cells. E, Example peristimulus spike-time histogram of an ON-OFF ganglion cell under control conditions (black traces) and in ACET (red traces), showing selective block of the OFF input. F, G, Average light-evoked conductances from OFF midget (n = 4) and OFF parasol ganglion cells (n = 4) in control conditions or after 0.1 μm ACET application. Average excitatory (AMPA, NMDA) and inhibitory conductances (Inhib) are shown separately (see Materials and Methods). OFF midget ganglion cells receive a prominent NMDA-mediated input, whereas OFF parasol ganglion cells could be adequately fit with a linear I-V relation. H, I, Summary of peak conductances in OFF midget (H) and OFF parasol (I) cells in control (Con, black symbols) or ACET (red symbols). The peak AMPA and NMDA conductance was measured during presentation of a dark spot (at time points indicated by black circle and black diamond symbols in F and G, respectively). The inhibitory conductance was measured at the termination of the dark spot (at time point indicated by black triangles in F and G).
