
Figure 2.
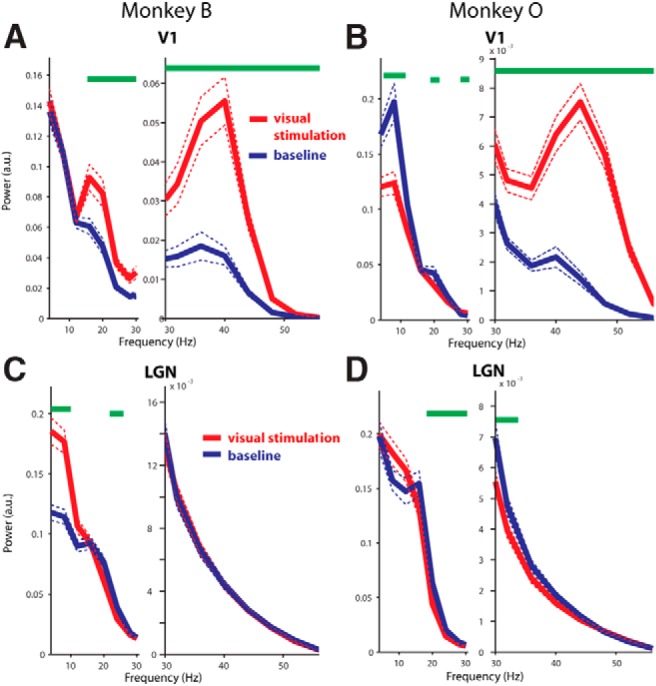
Power spectra of baseline and visual stimulation periods. A, B, Results from cortical recordings in Monkeys B and O, respectively. Red traces show power during visual stimulation and blue traces show power during the prestimulation baseline in which the monkeys maintained fixation on a central dot. Dotted lines represent the mean ± 2 SEM. Green bars indicate frequency bins that are significantly different between conditions. a.u., Arbitrary units. The spectra are broken between lower frequencies and frequencies surrounding the gamma peak to enhance visualization of the peaks. C, D, Results from LGN recordings in Monkeys B and O, respectively. Conventions similar to A and B.