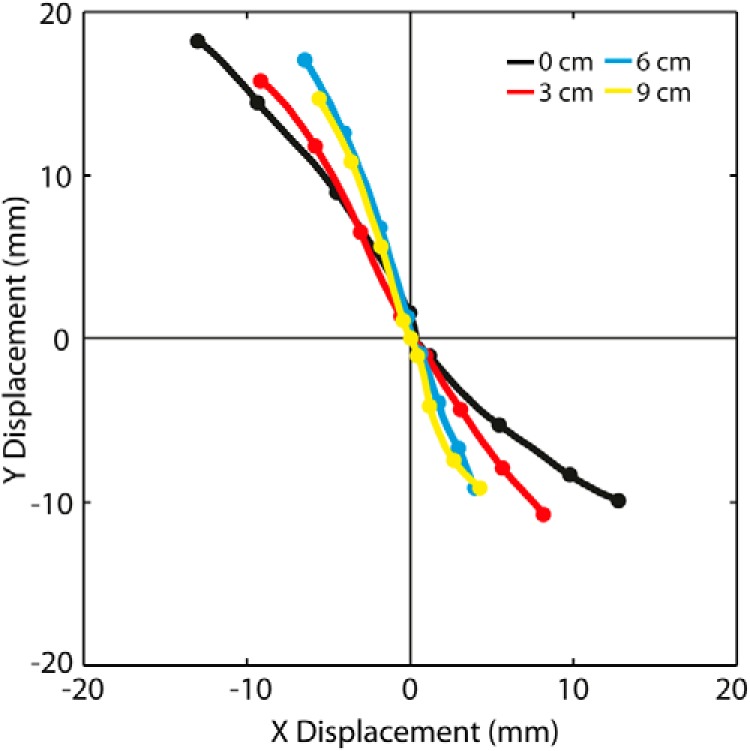
Figure 3.

Effect of stance width on GVS-evoked movement of C7 at −45° head angle viewed from above. Data are from experiment 1. The plot shows the X and Y components of the group-averaged C7 position at each stance width between 0 and 2 s from stimulus onset. Traces have been forced to the origin at t = 0. Unlike other figures of the experiment 1 evoked response, both stimulus polarities are plotted (ARCL responses move in +X and −Y; ALCR responses move in −X and +Y). Dots represent position every 0.5 s.
