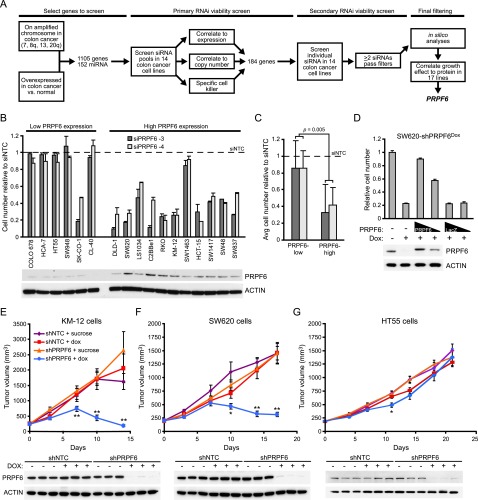
Figure 1.
Integrative genomic analysis identifies PRPF6 as a driver of colon cancer growth in vitro and in vivo. (A) Schematic of RNAi viability screens and filtering methods. (B) Relative cell number (compared with siNTC; mean ± SD) is shown for two independent PRPF6 siRNAs 6 d after siRNA transfection. Cell lines are separated by high or low PRPF6 protein expression levels as determined by immunoblot analysis. (C) The average relative cell number for each siRNA in each group of cells lines. P-value is a Student’s t-test. (D) The bar graph shows cell number relative to nontreated control in SW620 cells with stable integration of a doxycycline (Dox)-inducible PRPF6 shRNA (SW620-shPRPF6Dox). Doxycycline-induced PRPF6 knockdown is indicated. Adenoviruses expressing either shRNA-resistant PRPF6 or a LacZ control were infected 2 d after doxycycline-induced PRPF6 knockdown at both a low and high multiplicity of infection. Cell number was measured 7 d after doxycycline induction. Immunoblot shows PRPF6 expression under the indicated conditions. (E–G) Xenograft tumor volume measurements over time (n = 10–15 mice per group) in KM-12 cells (E), SW620 cells (F), or HT55 cells (G). Mean ± SEM is shown. Immunoblot of PRPF6 protein levels in xenograft tumors were at day 7. (*) P-value < 0.05; (**) P-value < 0.001 for shPRPF6 + Dox as compared with shNTC + Dox groups.

