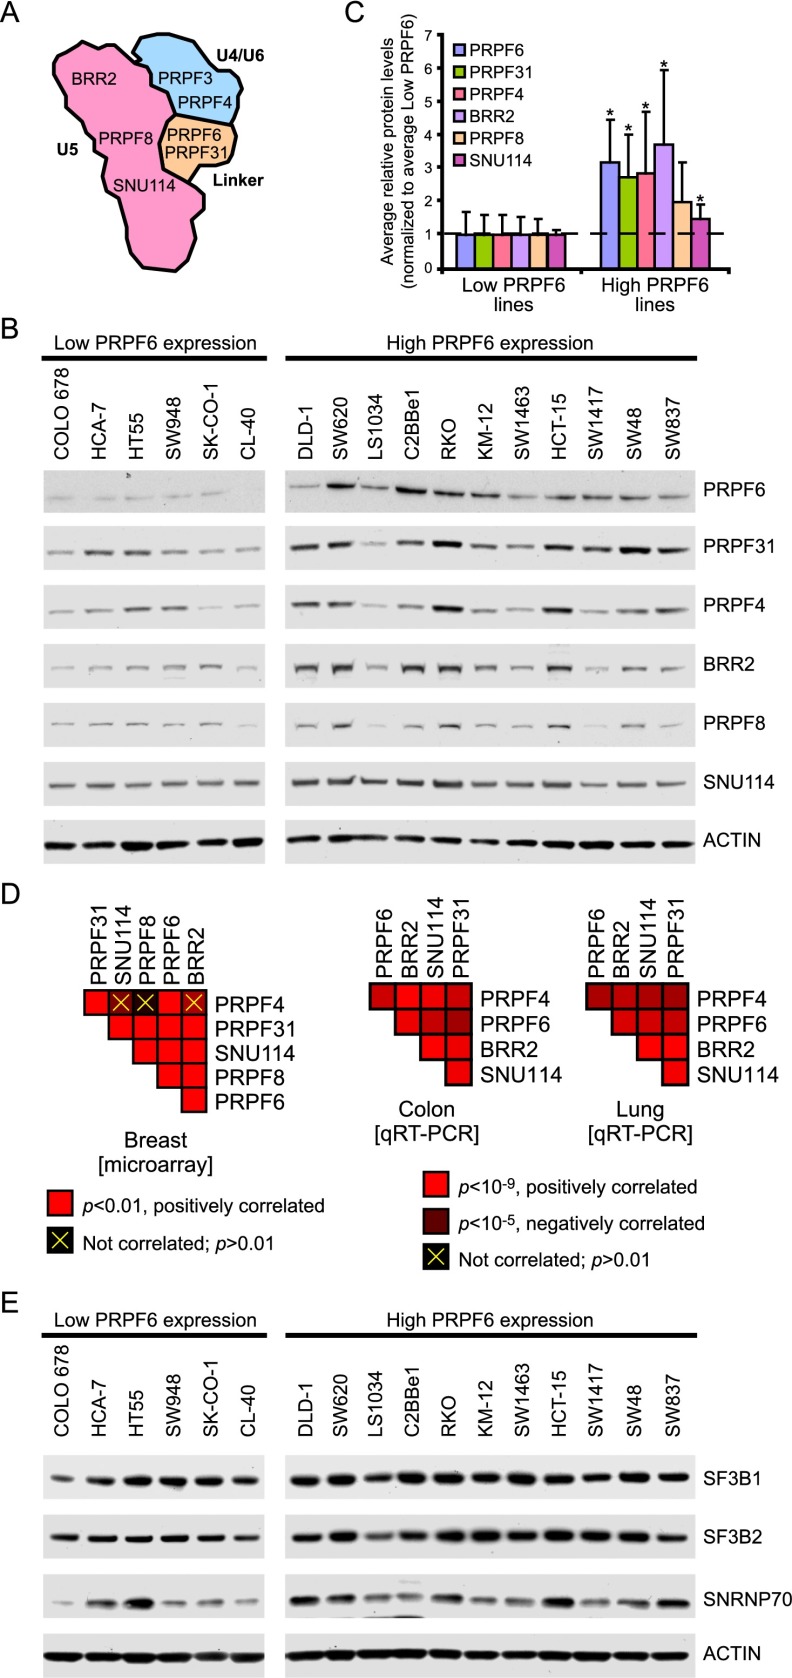
Figure 2.
The tri-snRNP complex is coordinately overexpressed in colon cancer. (A) A schematic of the tri-snRNP complex with select components indicated. Adapted by permission from Macmillan Publishers Ltd.: Nature Structural Biology (Häcker et al. 2008), © 2008. (B) Immunoblot of several tri-snRNP complex components in low- and high-PRPF6-expressing cell lines. The PRPF6 blot from Figure 1B that was used to classify each cell line as having high or low PRPF6 expression is shown here for reference. (C) The level of each protein from the immunoblot shown in B was quantified relative to ACTIN, and the mean ± SD protein level for each group of cell lines is provided. The values were normalized to the average expression of the low-PRPF6-expressing cell lines. (*) P < 0.05, Student’s t-test. (D) Gene expression data from microarray (left) or qRT–PCR (right) for the indicated tri-snRNP complex genes were correlated to each other in the indicated tumor types using Pearson correlation across all tumor samples. Red boxes indicate that the two genes are positively correlated according to the P-value scales provided. Correlations that are not significant are crossed out in yellow (P > 0.01). P-values are one-tailed t-tests. (E) Immunoblot of spliceosome components in low- and high-PRPF6-expressing cell lines.

