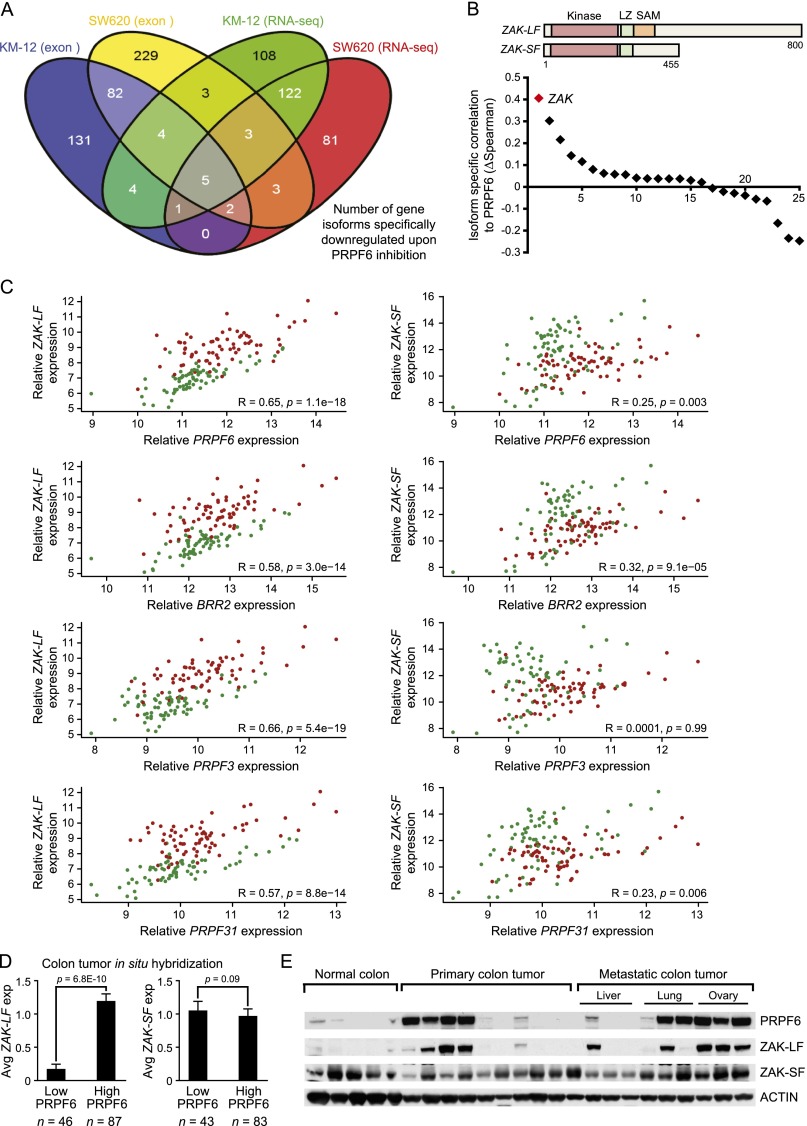
Figure 5.
PRPF6 regulates splicing of the ZAK protein kinase. (A) Gene isoform usage changes are analyzed after PRPF6 loss. A four-way Venn diagram illustrates the number of genes that have significantly reduced isoform expression upon PRPF6 depletion. Criteria for gene selection are reduced isoform usage in exon microarray (adjusted P-value <0.05) and RNA-seq data (adjusted P-value ≤0.005 and mean read counts >50) using two independent siRNAs targeting PRPF6 in at least one of two cell lines tested (KM-12 and SW620). (B) The distribution plot ranks the degree of correlation between PRPF6 expression and the 25 gene isoforms down-regulated after PRPF6 loss (ΔSpearman = [Spearmandownregulated isoform − Spearmanunchanged isoform]). A schematic of the domains of the different isoforms of the top-scoring gene (ZAK) is shown. (LZ) Leucine zipper domain; (SAM) sterile α motif. (C) The scatter plot shows expression correlation of tri-snRNP genes PRPF6, BRR2, PRPF3, and PRPF31 to long (ZAK-LF; NM_016653) and short (ZAK-SF; NM_133646) transcript variants of the ZAK gene. Each dot represents one sample. Green and red circles denote normal colon and colon cancer, respectively. Spearman’s rank correlation coefficients (R-values) and associated P-values are shown in each plot. (D) The bar graph shows the correlation between PRPF6 protein (IHC) and ZAK mRNA isoform expression (ISH) in human colon cancer samples. PRPF6-high and PRPF6-low cutoffs are defined as tumors in which ≥30% or <30% of the cancer cells express PRPF6 protein, respectively. ZAK mRNA expression is scored on a qualitative scale. (0) No expression; (1) weak; (2) moderate; (3) strong staining. Sample size for each cohort is indicated below the bar graph. Mean ± SD is shown, and P-values are indicated (Student’s t-test). (E) Immunoblot showing PRPF6 and ZAK isoform expression in the indicated human colon specimens.

