
Fig. 1.
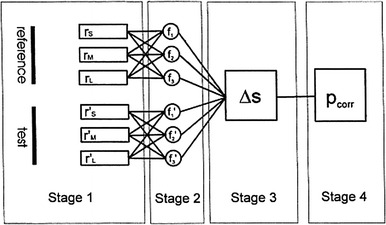
Schematic diagram of the four functional stages in the process of colour discrimination. Stage 1 receptor signals arise from quantum absorption (r) in the S, M and L-receptors for each of two different stimuli (reference and test stimulus). Quantum catches are transduced into graded voltage signals giving rise to receptor signals: {r S r M r L} for the reference stimulus and (r′S r′M r′L) for the alternative test stimulus. This stage may also include any postreceptoral processing if the segregation between different receptor types is preserved. Stage 2 neural coding of the receptor signals into achromatic and/or chromatic signals. Three coding units are depicted, the output of which is given by f 1 f 2 f 3 and f′1 f′2 f′3, for the reference and test stimulus, respectively. The units depicted here by a single symbol may represent several morphological and/or physiological layers. Stage 3 the two sets of signals are compared and evaluated. The output of this stage is the computed difference between stage 2 signals using a particular algorithm. Metric models will calculate a perceptual distance ΔS for the stimulus pair. Stage 4 the behavioural response, which is represented by the probability p corr that one of two stimuli is selected. According to the metric approach p corr depends on ΔS alone. Reprinted from Brandt and Vorobyev (1997), with permission from Elsevier