
Fig. 2.
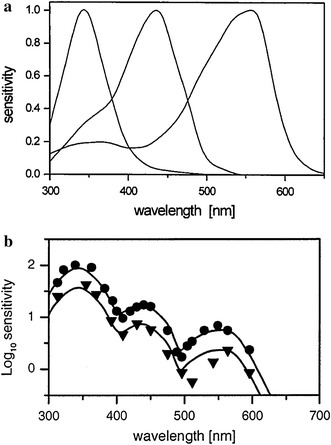
Spectral sensitivity of the honeybee. a Spectral sensitivity curves of the three photoreceptor types of the honeybee (Menzel and Backhaus 1991). The functions are scaled to the maximal sensitivity of each receptor at their peak wavelength (S—344 nm, M—436 nm, L—556 nm). b Behavioural threshold spectral sensitivity of the honeybee (symbols) and the predicted threshold function by the RNL Colour-Opponent model (solid curve, Vorobyev and Osorio 1998). The behavioural data were obtained by von Helversen (1972) with two bees (bee 25—circles, bee 15—triangles, bee numbers as given in the original paper). Reprinted from Vorobyev et al. (2001a), with permission from Elsevier