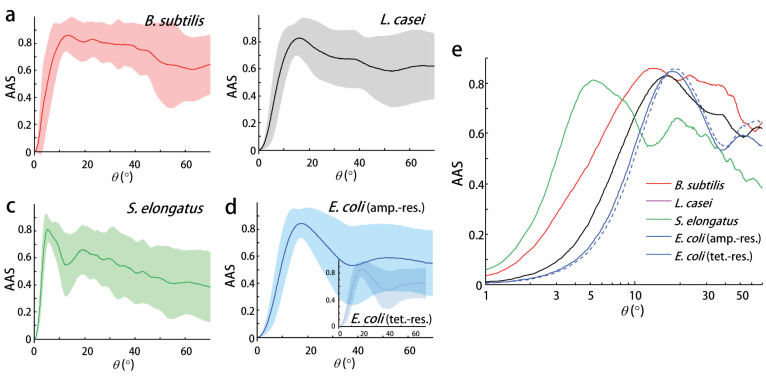
Figure 3. AAS spectra reflecting the species-specific characteristics.
AAS spectra as a function of the scattering angle associated with the individual bacteria in the species (a) B. subtilis, (b) L. casei, (c) S. elongatus, and (d) ampicillin-resistant E. coli. The inset of (d) presents the results of the E. coli with tetracycline-resistance. The thick lines denote the average value and the areas represent the standard deviation for 64, 93, 162, 143, and 129 cells of B. subtilis, L. casei, S. elongatus, ampicillin-resistant E. coli, and tetracycline-resistant E. coli species, respectively. (e) The averaged AAS spectra from the four species are plotted together for comparison (scattering angles are denoted in log-scale).

