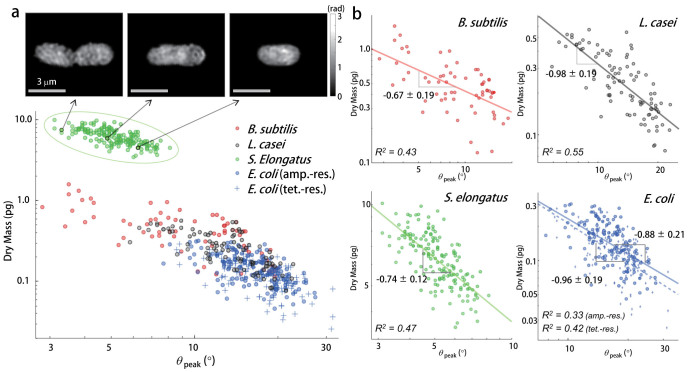
Figure 4. Correlation between AAS peak angle and cellular dry mass.
(a) Scatter plots of the scattering angle for the first maximum AAS (θpeak) and the cellular dry mass of B. subtilis, L. casei, S. elongatus, ampicillin-resistant E. coli, and tetracycline-resistant E. coli species. Quantitative images for the three S. elongatus cells in various stages of cell growth are presented and the corresponding data are marked in the scatter plot. (b) The bacterial cells of each species are plotted separately in log-log scale. The fitted curves are also presented with the values for slopes and R2 obtained using least squares fitting.

