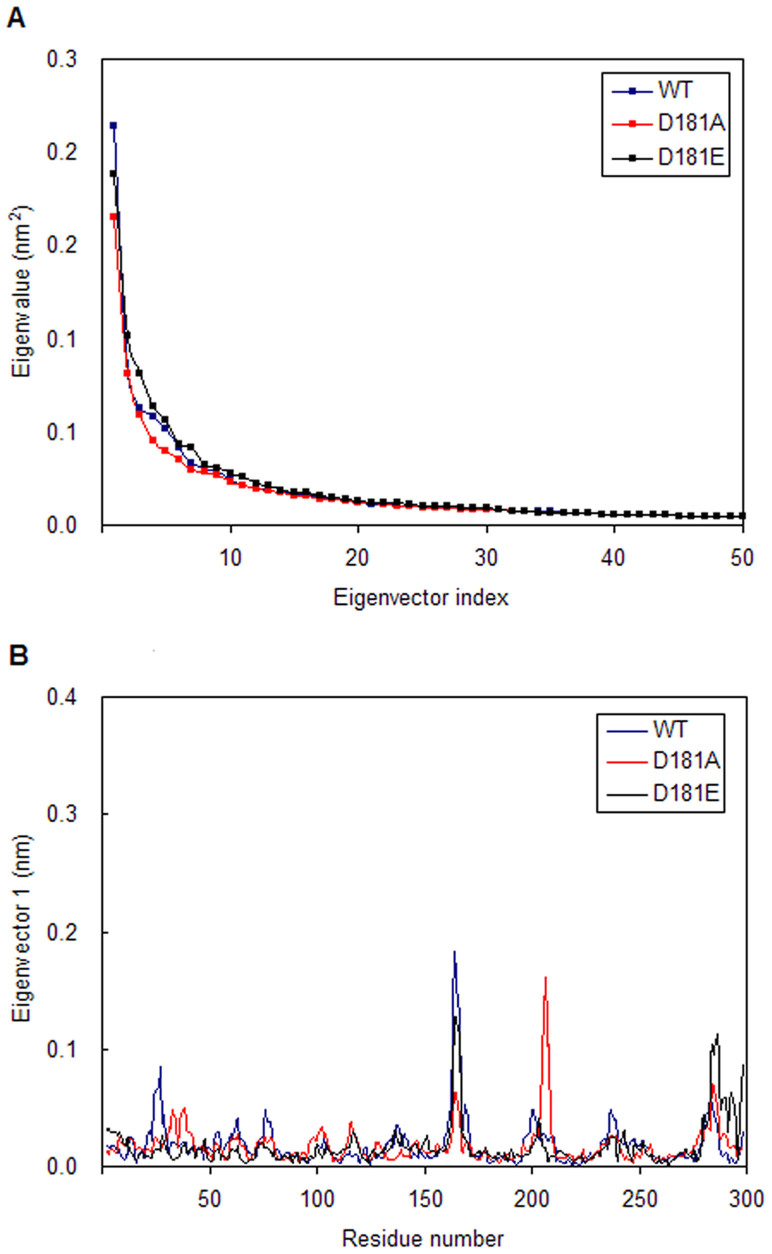
Figure 4. The results of principal component analysis.
(A) The eigenvalues plotted against the corresponding eigenvector indices obtained from the Cα covariance matrix constructed from the last 30 ns of MD simulations. (B) Displacements of the components of the wild type and its mutants for the first eigenvector.

