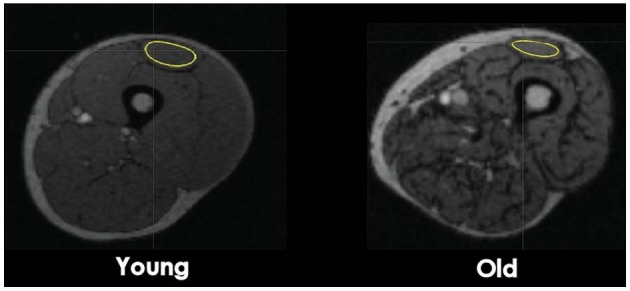
Figure 1.

Transaxial CT images at a mid-thigh level. Computed Tomography images of a cross-section of the femoral region from a young and old man subject. The regions of interest (ROI) used for glucose uptake heterogeneity analysis were drawn around the quadriceps femoris (QF) muscles, four knee flexors muscles, and three hip muscles. For muscle volume analysis, ROIs were draw around the four next extensor muscles. ROI of the rectus femoris is shown as an example.
