
Figure 3.
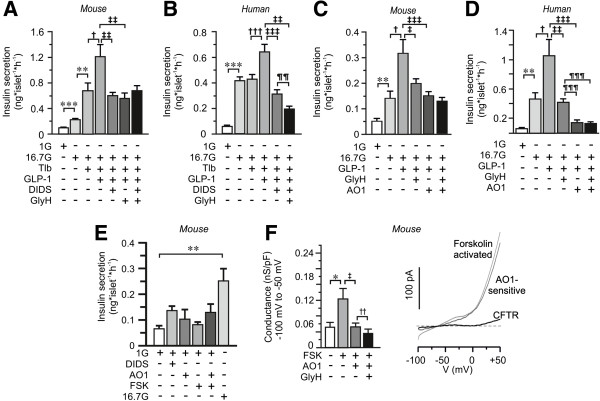
The combined effect of chloride channel blockers on GLP-1 enhanced GSIS. (A) Insulin secretion from mouse islets after 1 h incubation in 1 mM glucose (1G), 16.7 mM glucose (16.7G), tolbutamide (Tlb), GLP-1, DIDS- and GlyH-101 as indicated (n = 12 to 20, N = 4). (B) The same as in A, but insulin secretion was measured from human islets (n = 20 to 28, N = 5). (C) As in A, but the impact of the anoctamin 1 inhibitor TM16Ainh-AO1 (AO1) on GLP-1 enhanced insulin secretion was investigated in mouse islets (n = 14, N = 3). (D) As in C, but experiments were performed on human islets (n = 4, N = 1). (E) As in C, but the effects of forskolin (FSK) and AO1 was investigated at 1 mM glucose as indicated. Data are presented as mean ± SEM., **P <0.01, ***P <0.005, †P <0.05, †††P <0.005, ‡P <0.05, ‡‡P <0.01, ‡‡‡P <0.005 ¶¶P <0.01. (F) Bar graph of membrane conductance at negative (left) membrane potentials in the absence and presence of FSK, TM16Ainh-AO1 (AO1) and GlyH-101 (GlyH) (n = 6, N = 4). Calculated FSK-activated, AO1-sensitive and CFTR-currents shown to the right are mean of n = 5 cells. Data are presented as mean ± SEM. *P <0.05, ‡P <0.05, ‡‡P <0.01.