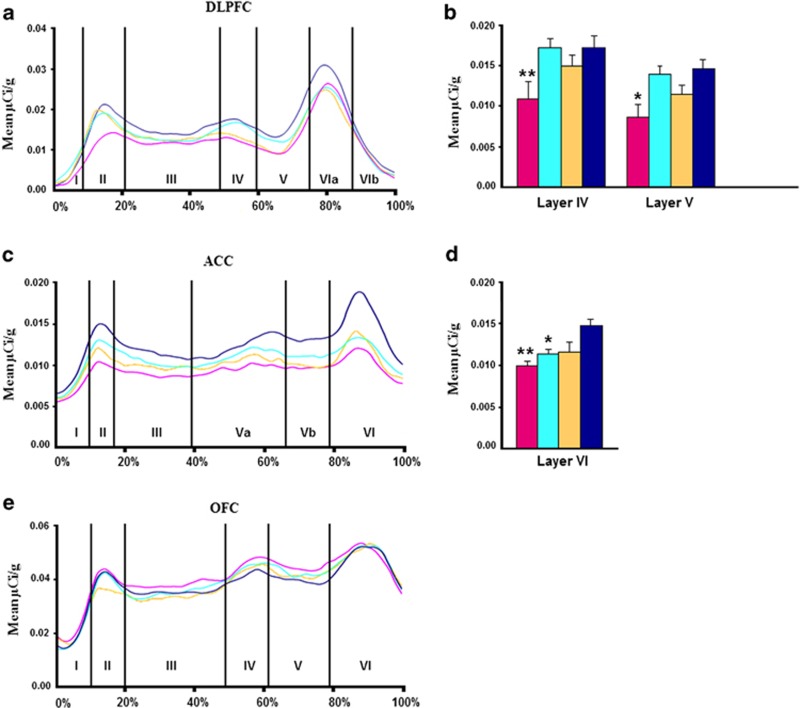
Figure 2.
Profiles showing the mean BDNF mRNA levels (μCi g−1) for schizophrenia (pink), depression (light blue), bipolar disorder (yellow) and normal controls (dark blue), as a function of distance from the pial surface (a) DLPFC, (c) ACC, (e) OFC. Percentages on the x axis refer to proportion of total cortical width occupied by specific lamina. Post hoc testing revealed (b) schizophrenia group with significantly less BDNF mRNA than controls in layers IV and V of DLPFC and (d) schizophrenia and depressed with significantly less BDNF mRNA than controls in layer VI of ACC. *P<0.05, **P<0.01.

