Figure 3.
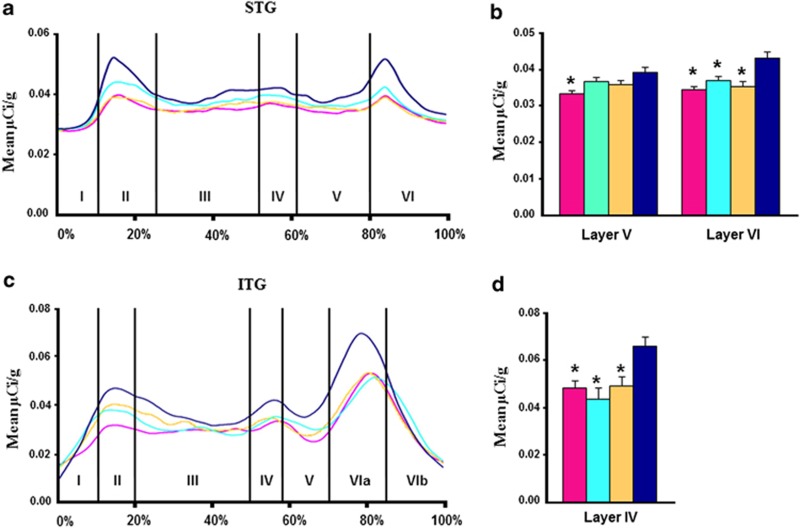
Profiles showing the mean BDNF mRNA levels (μCi g−1) for the schizophrenia (pink), depression (light blue), bipolar disorder (yellow) and normal controls (dark blue), as a function of distance from the pial surface (a) STG, (c) ITG. Percentages on the x axis refer to proportion of total cortical width occupied by specific lamina. Post hoc testing revealed (b) schizophrenia group with significantly less BDNF mRNA than controls in layers V and all three diagnostic groups with significantly less BDNF mRNA than controls in layer VI of STG and (d) all three diagnostic groups with significantly less BDNF mRNA than controls in layer IV of ITG. *P<0.01.

