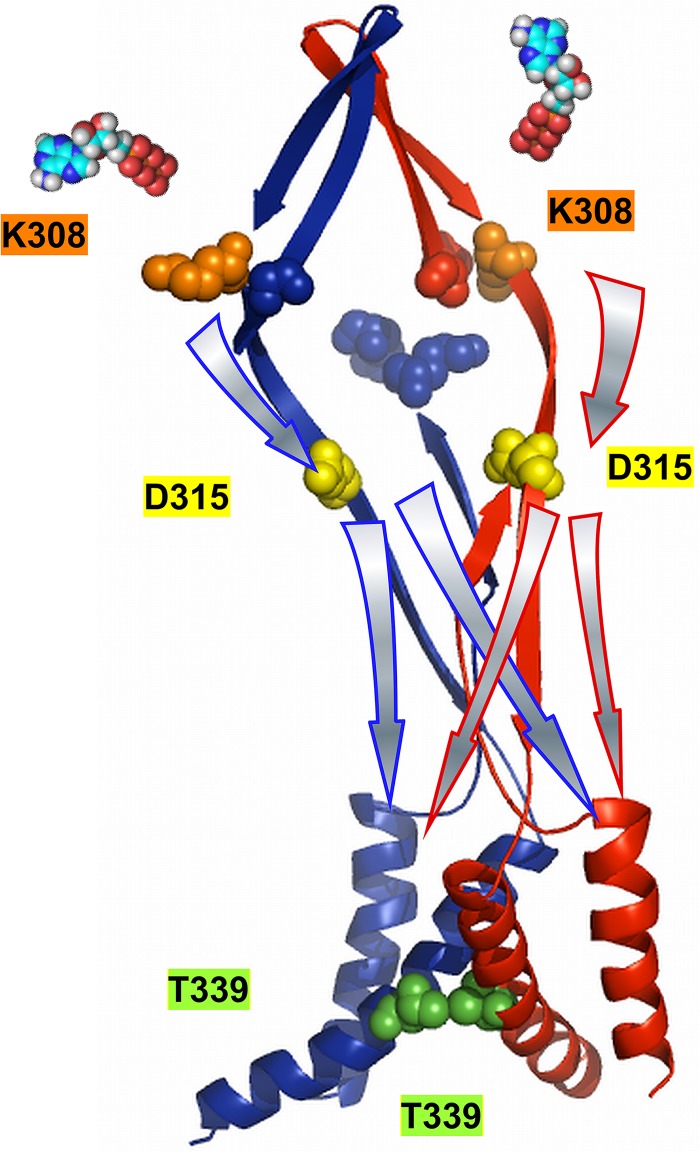
Figure 11.
Schematic presentation of the activation signal transmission from two ATP-binding sites to the pore upon voltage- and [ATP]-dependent activation. For simplicity, two subunits are illustrated in red and blue. Colored spheres mark the K308 (orange) and K69 (blue) residues in the ATP-binding region, D315 (yellow) in the linker, and T339 (green) at the pore level. Arrows with the same color of borderlines with the subunits depict the signal transmission on each subunit. The activation signal from one intersubunit ATP binding flows directly on the corresponding β-14 strand of the ATP-binding site down to the D315 level, and then spreads to other subunits at the pore level.

