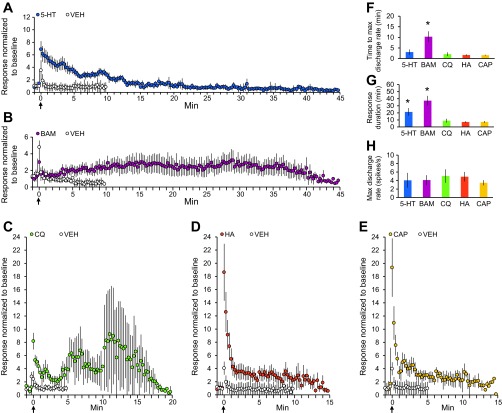
Fig. 5.
Characterization of the mean response to each pruritogen or partial pruritogen. A: mean response to serotonin (blue); mean response to vehicle in serotonin-responsive cells (white) (n = 22). B: mean response to BAM8–22 (purple); mean response to vehicle in BAM8–22-responsive cells (white) (n = 6). C: mean response to chloroquine (green); mean response to vehicle in chloroquine-responsive cells (white) (n = 7). D: mean response to the partial pruritogen histamine (orange); mean response to vehicle in histamine-responsive cells (white) (n = 23). E: mean response to the partial pruritogen capsaicin (yellow); mean response to vehicle in capsaicin-responsive cells (white) (n = 13). F: mean time to reach maximum discharge rate, calculated by finding the highest discharge rate in a 60-s sliding window following stimulus application for each pruritogen and partial pruritogen. *P = 0.0038, Kruskal-Wallis ANOVA. G: mean time to return to baseline discharge rate, calculated by determining when the mean discharge rate in a 60 s sliding window following stimulus application dropped below 1.5 times the mean discharge rate over 60 s before stimulus application. *P = 0.0057, Kruskal-Wallis ANOVA. H: mean maximum discharge rate for each pruritogen and partial pruritogen. Data only included from neurons for which the receptive field was not manipulated during the response to a chemical. For A–E: data were normalized to 60 s of baseline activity preceding stimulus application and reported in 15-s bins.

