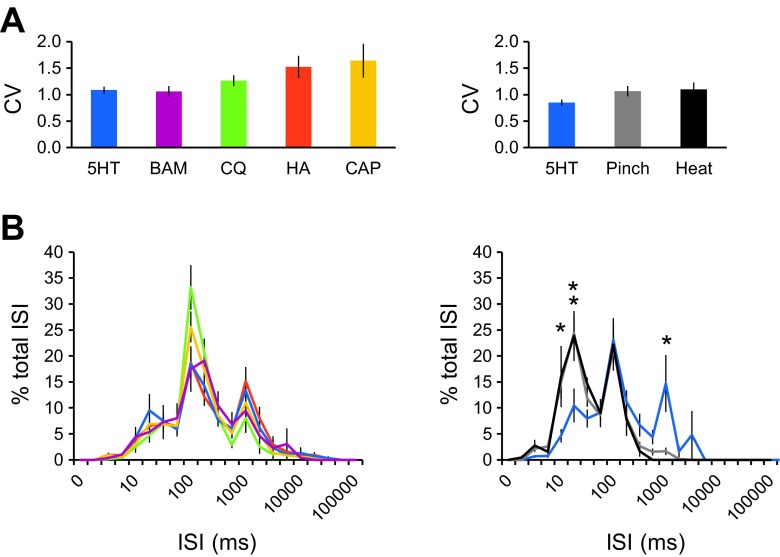
Fig. 6.
Analysis of spike timing dynamics and spike patterns in pruriceptive VTT neurons. A: coefficient of variation (CV) of interspike intervals (ISIs) for responses to each pruritogen or partial pruritogen, and for responses to noxious stimuli within serotonin-responsive neurons. B: ISI distribution histograms for responses to each pruritogen or partial pruritogen, and for responses to noxious stimuli within serotonin-responsive neurons. *P < 0.05, **P < 0.005, Kruskal-Wallis ANOVA. Colors in B correspond to colors labeled for each stimulus in A. Data compiled from same set of neurons used in Fig. 5.

