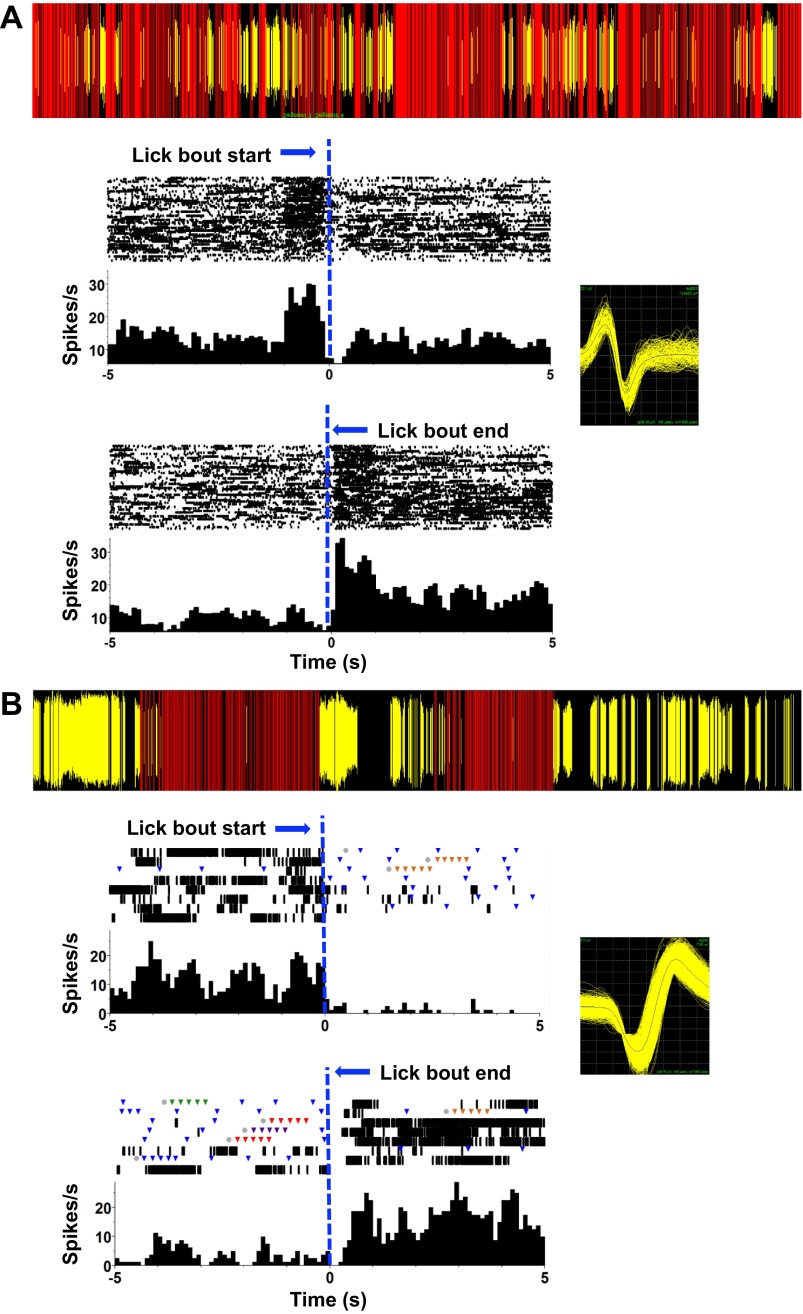
Fig. 10.
Examples of firing patterns of anti-lick cells in PbN. The lick events and firing patterns of the cells over a short time period during the recording session are shown at top of each panel. Red lines indicate the occurrence of a lick; yellow lines indicate the occurrence of a spike. Rasters and PSTHs below in each panel show activity 5 s before the lick bout begins (top) and 5 s after the lick bout ends (bottom). Lick bout beginning or end is indicated by a vertical dashed blue line positioned at the transition time. Bin size = 100 ms. Insets: waveforms of the cells recorded in A and B. A: example of an anti-lick PbN cell that shows a surge in firing rate before a lick bout and again at the end of a lick bout and a moderate decrease in firing rate while the animal is licking. B: example of an anti-lick PbN cell that fires before and after a lick bout and is completely silent during the lick bout.

