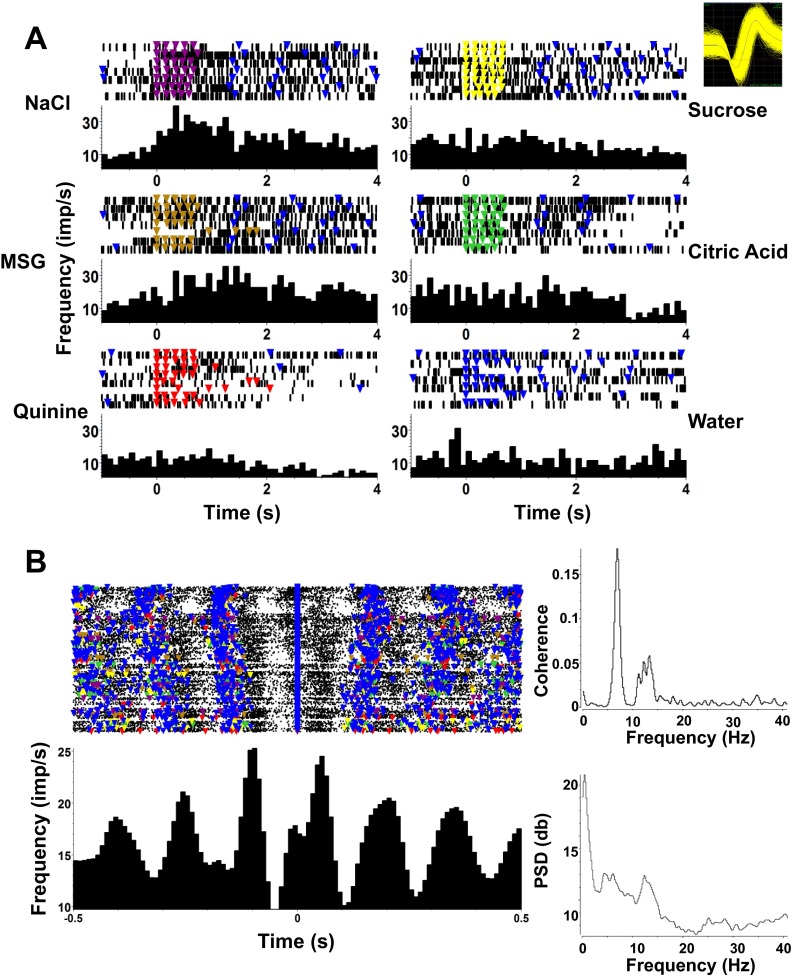
Fig. 6.
Example of a taste-responsive PbN cell that shows lick-related as well as taste-related firing. A: this cell shows significant responses to NaCl and MSG. Format is as in Fig. 3. Inset, top right: waveform of cell recorded in A and B. B, left: raster and PSTH of this cell, centered around the occurrence of a lick, either reinforced with fluid or dry, reveal strongly lick-related firing. Right: spike-lick coherence (top) and spike power spectral density (PSD; bottom) plots.

