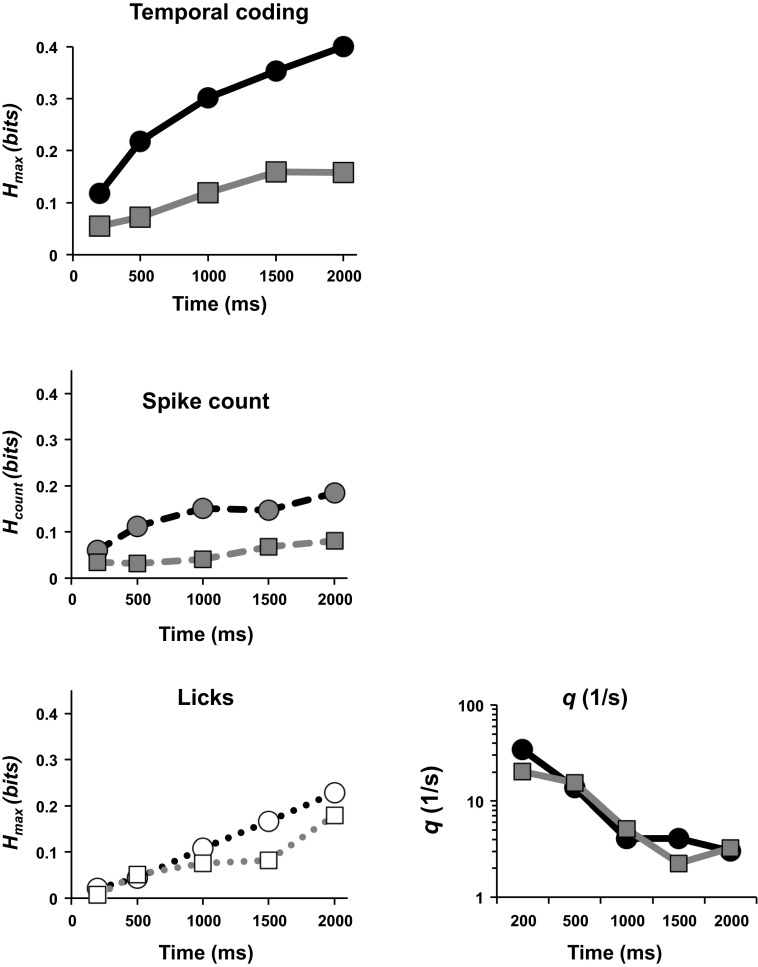
Fig. 8.
Information in neural responses (average per cell) for PbN and NTS cells conveyed by spike timing (top left), by spike count alone (middle left), and in the pattern of licks (bottom left; see text for further details). Circular symbols denote results from PbN; square symbols denote results from NTS. Each point was calculated as the sum of Hmax for the neural response (top left), Hcount (middle left), or Hmax for licks (bottom left) values for all cells that showed a significant amount of information about taste quality, divided by the total number of cells recorded. As longer response intervals are considered, the amount of information carried by temporal coding is larger in PbN cells compared with NTS cells and exceeds the information in the lick responses. Bottom right: geometric mean for temporal precision of all cells with significant information from temporal coding in both PbN and NTS. NTS data replotted from Roussin et al. (2012).

