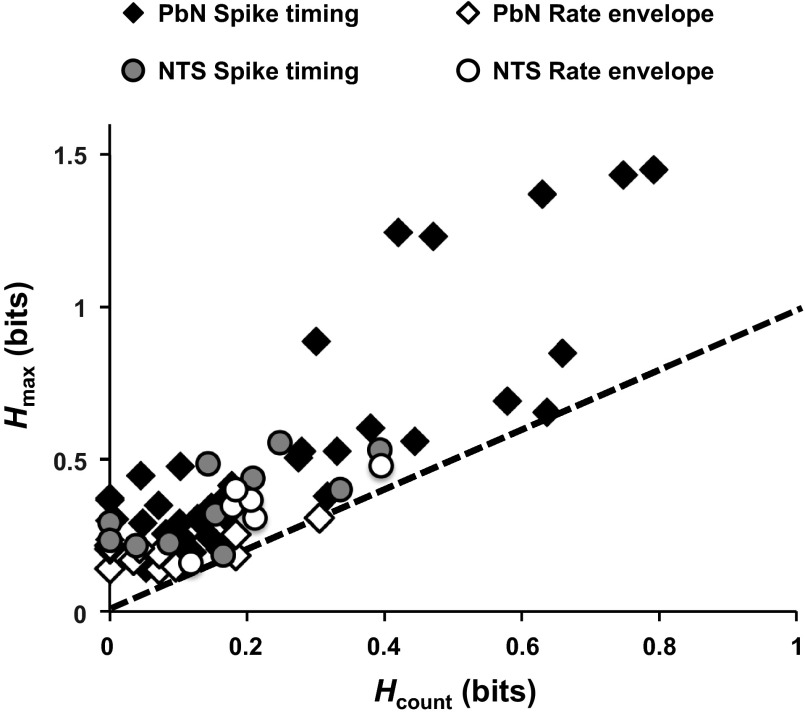
Fig. 9.
Information conveyed about taste quality (average per cell) at 2 s in PbN and NTS by rate and spike timing. Dashed diagonal line indicates equality between Hmax and Hcount. Cells above the diagonal use the rate envelope (n = 27 for PbN, n = 11 for NTS) or spike timing (n = 11 for PbN, n = 7 for NTS) in addition to spike count to discriminate among taste quality at 2 s. NTS data replotted from Roussin et al. (2012).

