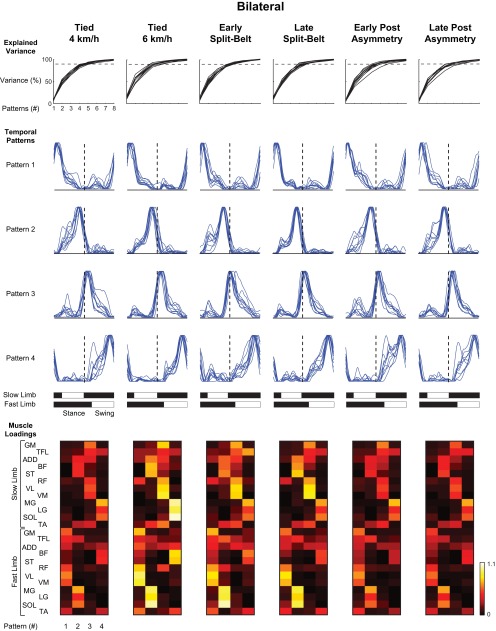
Fig. 4.
Nonnegative matrix factorization of bilateral muscle activations. The top row of line plots illustrates the percentage of variance explained by decomposing the EMG signals into 1–8 patterns. Each black line in these plots represents the percentage of explained variance calculated for a single participant. The horizontal dashed line in these plots indicates 90% of explained variance. The middle portion of the figure shows the 4 temporal patterns extracted from the EMG data that are ordered by location of the dominant peak with reference to heel contact of the fast limb. Each blue trajectory shows a temporal pattern extracted for a single participant, and the dashed vertical line indicates 50% of the fast limb gait cycle. Stance and swing phases for the fast and slow limbs are shown below for reference. Group-averaged pattern loadings for the 4 extracted patterns are shown in the bottom portion of the figure. Note the asymmetry between fast and slow limbs for the loadings related to the quadriceps (RF, VL, and VM) and ankle plantar flexor (MG, LG, and SOL) muscles.

