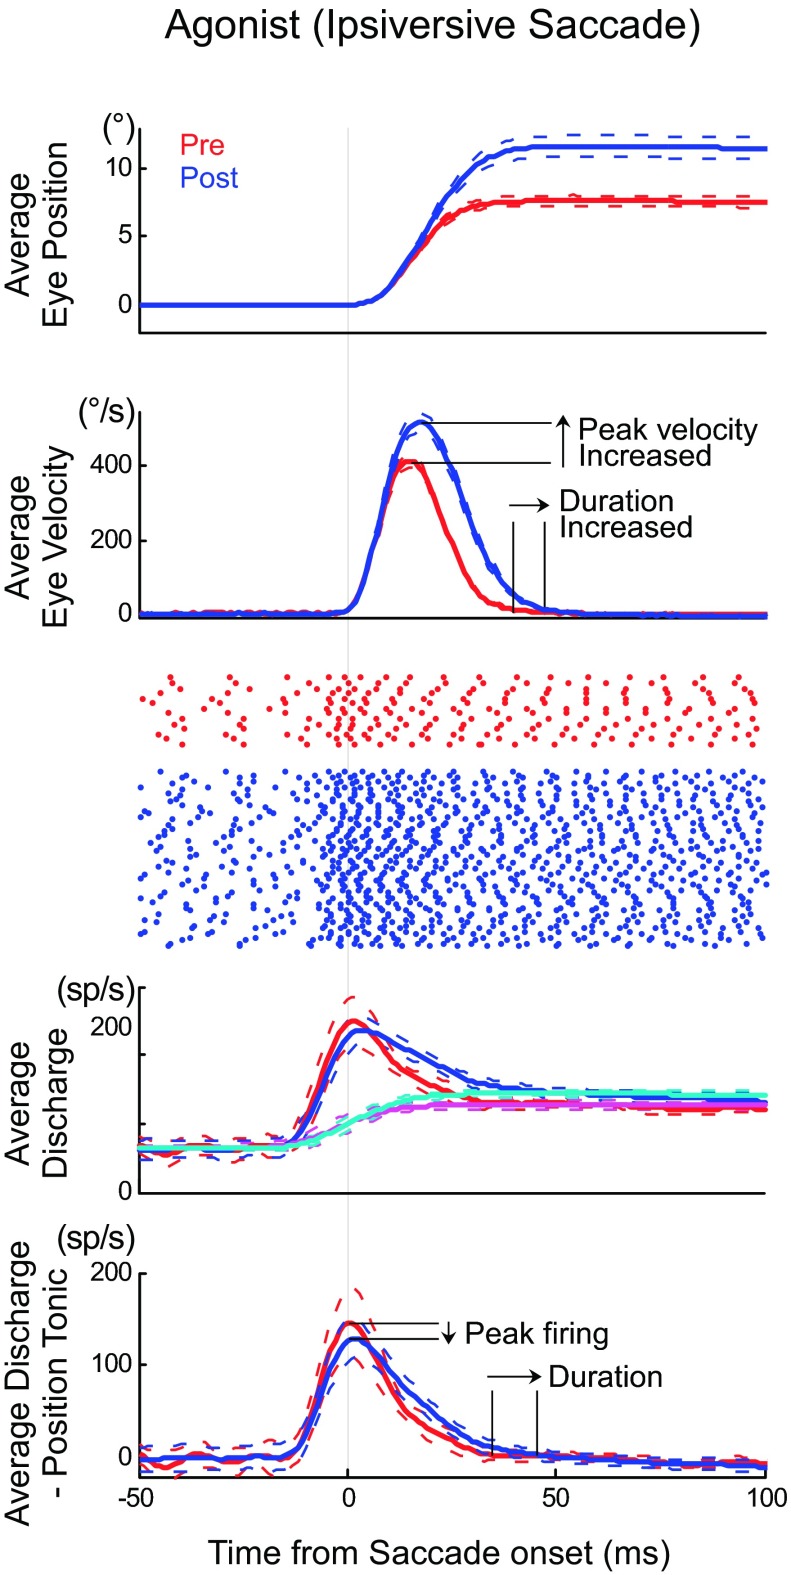
Fig. 2.
Activity in an example ABD neuron (unit 14 in Table 1) during ipsiversive saccades. Top: average pre- (red) and postinactivation (blue) eye position during saccades tracking an 8° target movement. The dashed lines show 1 SD from the mean (number of trials: pre = 14, post = 86). Second panel: average velocity traces of these saccades. Third panel: raster plots of ABD firing during these saccades. Fourth panel: average spike (sp) density function of ABD discharge for these saccades and the tonic activity related to eye position using predicted eye position (pre: magenta, post: cyan). Bottom: burst component of the ABD discharge, i.e., the saccade-related discharge after we subtracted the position-related discharge. All traces aligned on saccade onset.

