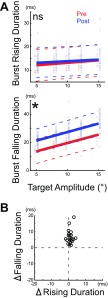
Fig. 5.
Comparison of the change caused in the rising and falling phases of the burst in an ABD neuron by cFN inactivation. A: plot of the burst duration during rising (top) and falling (bottom) phases as a function of target amplitude (unit 14). Regression lines of pre- (red) and postinactivation (blue) are significantly different in falling duration (*P < 0.05). Each point indicates 1 saccade. We shifted the blue postinactivation points slightly rightward and red preinactivation points slightly leftward to make them distinguishable. B: summary of all 22 experiments (units 1–22). Each point indicates average results for 1 experiment.

