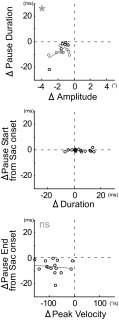
Fig. 7.
Summary of the change in each attribute of all 15 experiments that showed a significant hypometria for contraversive saccade (Table 1). Each point indicates the average results of 1 experiment. *Regression line (gray line) significantly different from 0 (P < 0.05).

