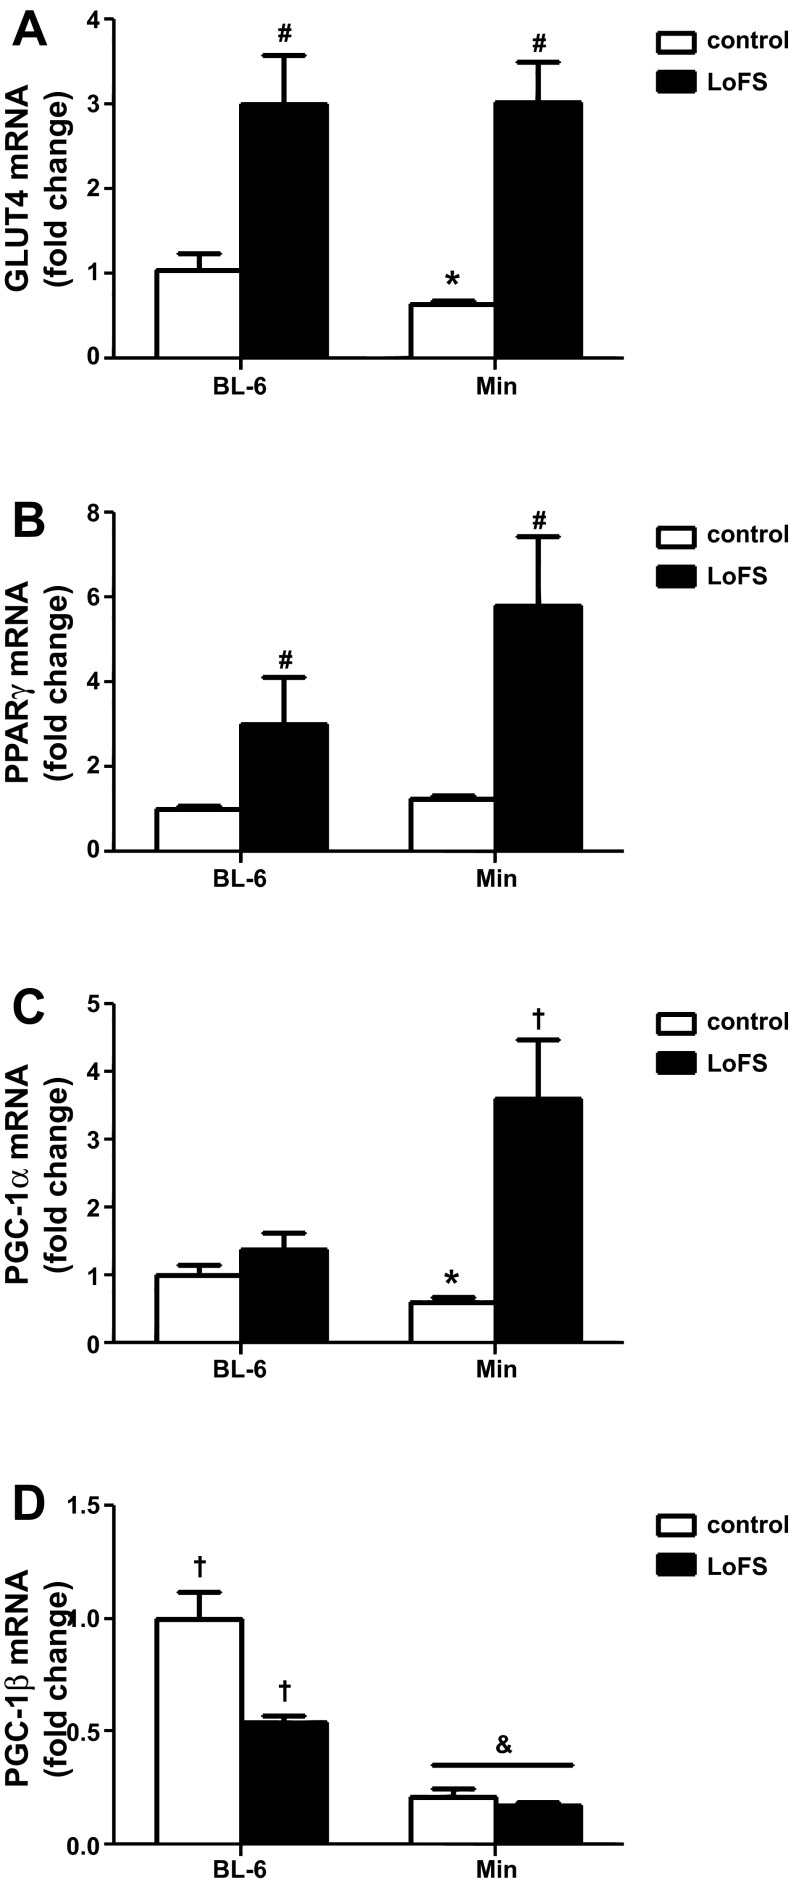
Fig. 2.
Metabolic gene response to a novel bout of low-frequency stimulated contraction. mRNA levels are shown of glucose transporter-4 (GLUT-4; A), peroxisome proliferator-activated receptor-γ (PPAR-γ; B), peroxisome proliferator-activated receptor-α coactivator-1 (PGC-1α; C), and PGC-1β (D) 3 h after a novel bout of contraction in healthy wild-type (BL-6, n = 5) and cachectic Min (n = 5) mice. Values are means ± SE. *Significantly different from BL-6 control from preplanned t-test; #main effect low-frequency stimulation (LoFS); &main effect genotype; †significantly different from all other comparisons: P < 0.05.

