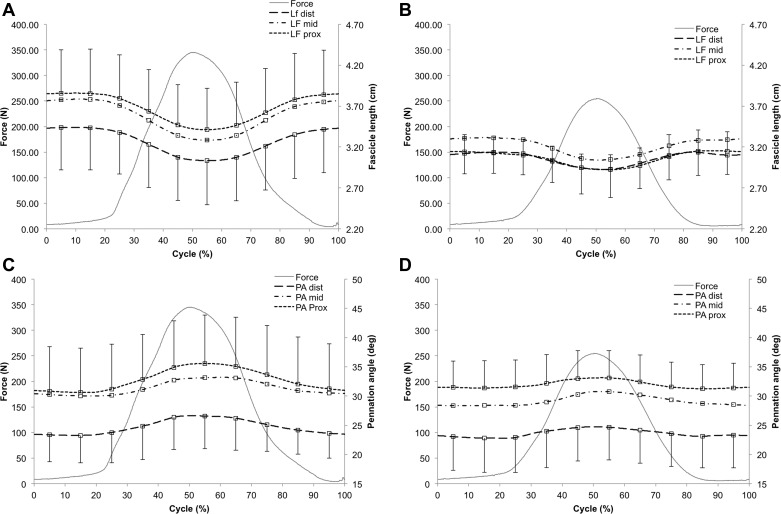
Fig. 3.
Dynamic changes in gastrocnemius medialis fascicle length (LF; A and B) and pennation angles (PA; C and D) during submaximal isometric contraction as measured in YW (n = 6) and SW (n = 6). Note, subplots A and C reflect the data measured in YW (n = 6), B and D represent the results obtained in the SW cohort (n = 6). Values are means ± SD.

