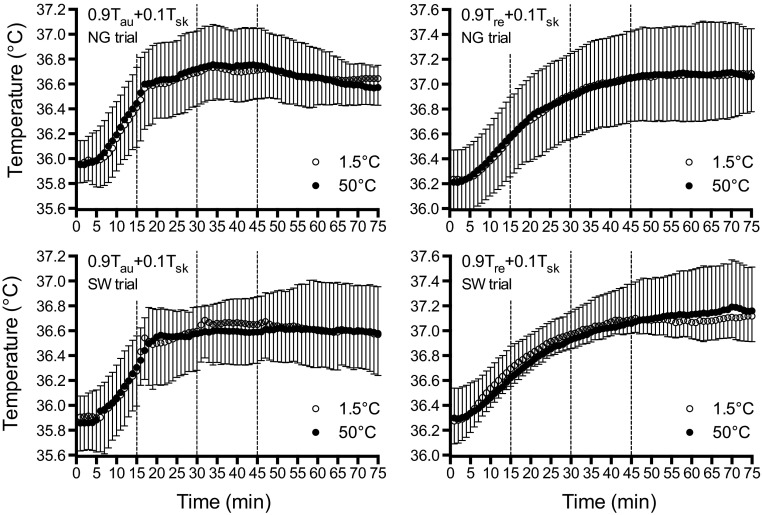
Fig. 6.
Mean body temperatures using a 0.9/0.1 weighting of core to skin temperatures using Tau (left) and Tre (right) as an indication of the body core, with 1.5°C (open circles) and 50°C (black circles) fluid during the NG trials (top) and SW trials (bottom). Dashed lines denote when fluids were ingested/administered. Error bars indicate SD.

