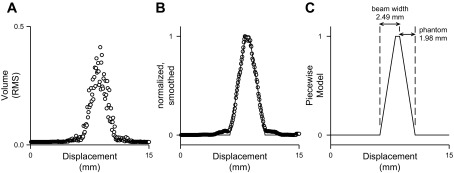
Fig. 2.
Representative data for determination of beam width. A: raw data [the root mean square (RMS) volume of the returned signal] from one trial obtained during phase 1. B: the same data after normalization and smoothing, with the piecewise model solution superimposed. C: the piecewise model solution with the beam width and phantom width indicated.

